
Page 31 - Geochemical Anomaly and Mineral Prospectivity Mapping in GIS
P. 31
Spatial Data Models, Management and Operations 27
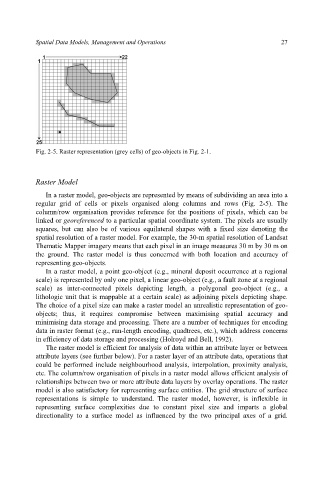
Fig. 2-5. Raster representation (grey cells) of geo-objects in Fig. 2-1.
Raster Model
In a raster model, geo-objects are represented by means of subdividing an area into a
regular grid of cells or pixels organised along columns and rows (Fig. 2-5). The
column/row organisation provides reference for the positions of pixels, which can be
linked or georeferenced to a particular spatial coordinate system. The pixels are usually
squares, but can also be of various equilateral shapes with a fixed size denoting the
spatial resolution of a raster model. For example, the 30-m spatial resolution of Landsat
Thematic Mapper imagery means that each pixel in an image measures 30 m by 30 m on
the ground. The raster model is thus concerned with both location and accuracy of
representing geo-objects.
In a raster model, a point geo-object (e.g., mineral deposit occurrence at a regional
scale) is represented by only one pixel, a linear geo-object (e.g., a fault zone at a regional
scale) as inter-connected pixels depicting length, a polygonal geo-object (e.g., a
lithologic unit that is mappable at a certain scale) as adjoining pixels depicting shape.
The choice of a pixel size can make a raster model an unrealistic representation of geo-
objects; thus, it requires compromise between maximising spatial accuracy and
minimising data storage and processing. There are a number of techniques for encoding
data in raster format (e.g., run-length encoding, quadtrees, etc.), which address concerns
in efficiency of data storage and processing (Holroyd and Bell, 1992).
The raster model is efficient for analysis of data within an attribute layer or between
attribute layers (see further below). For a raster layer of an attribute data, operations that
could be performed include neighbourhood analysis, interpolation, proximity analysis,
etc. The column/row organisation of pixels in a raster model allows efficient analysis of
relationships between two or more attribute data layers by overlay operations. The raster
model is also satisfactory for representing surface entities. The grid structure of surface
representations is simple to understand. The raster model, however, is inflexible in
representing surface complexities due to constant pixel size and imparts a global
directionality to a surface model as influenced by the two principal axes of a grid.