
Page 56 - Geochemical Anomaly and Mineral Prospectivity Mapping in GIS
P. 56
Exploratory Analysis of Geochemical Anomalies 55
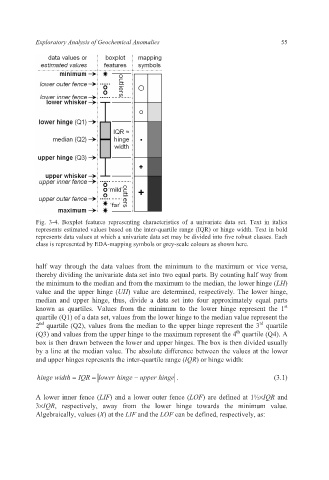
Fig. 3-4. Boxplot features representing characteristics of a univariate data set. Text in italics
represents estimated values based on the inter-quartile range (IQR) or hinge width. Text in bold
represents data values at which a univariate data set may be divided into five robust classes. Each
class is represented by EDA-mapping symbols or grey-scale colours as shown here.
half way through the data values from the minimum to the maximum or vice versa,
thereby dividing the univariate data set into two equal parts. By counting half way from
the minimum to the median and from the maximum to the median, the lower hinge (LH)
value and the upper hinge (UH) value are determined, respectively. The lower hinge,
median and upper hinge, thus, divide a data set into four approximately equal parts
st
known as quartiles. Values from the minimum to the lower hinge represent the 1
quartile (Q1) of a data set, values from the lower hinge to the median value represent the
rd
nd
2 quartile (Q2), values from the median to the upper hinge represent the 3 quartile
th
(Q3) and values from the upper hinge to the maximum represent the 4 quartile (Q4). A
box is then drawn between the lower and upper hinges. The box is then divided usually
by a line at the median value. The absolute difference between the values at the lower
and upper hinges represents the inter-quartile range (IQR) or hinge width:
hinge width = IQR = lower hinge − upper hinge . (3.1)
A lower inner fence (LIF) and a lower outer fence (LOF) are defined at 1½×IQR and
3×IQR, respectively, away from the lower hinge towards the minimum value.
Algebraically, values (X) at the LIF and the LOF can be defined, respectively, as: