
Page 126 - Geochemical Remote Sensing of The Sub-Surface
P. 126
Spontaneous potentials and electrochemical cells 103
t ..... \, ......... I .........................
-200 Equipontential lines, mY. ~ Electron flow
--'- (Positive} Current flow
Direction of ion movement ~{ J Sulfide
(c) Cathode (4) Anode
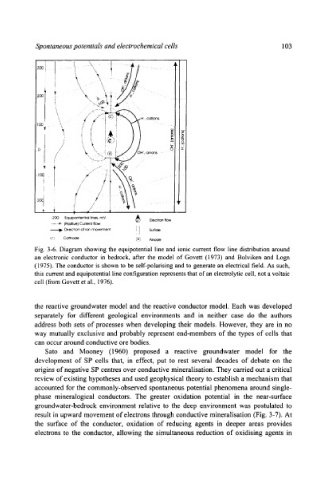
Fig. 3-6. Diagram showing the equipotential line and ionic current flow line distribution around
an electronic conductor in bedrock, after the model of Govett (1973) and Bolviken and Logn
(1975). The conductor is shown to be sel[-polafising and to generate an electrical field. As such,
this current and equipotential line configuration represents that of" an electrolytic cell, not a voltaic
cell (from Govett et al., 1976).
the reactive groundwater model and the reactive conductor model. Each was developed
separately for different geological environments and in neither case do the authors
address both sets of processes when developing their models. However, they are in no
way mutually exclusive and probably represent end-members of the types of cells that
can occur around conductive ore bodies.
Sato and Mooney (1960) proposed a reactive groundwater model for the
development of SP cells that, in effect, put to rest several decades of debate on the
origins of negative SP centres over conductive mineralisation. They carried out a critical
review of existing hypotheses and used geophysical theory to establish a mechanism that
accounted for the commonly-observed spontaneous potential phenomena around single-
phase mineralogical conductors. The greater oxidation potential in the near-surface
groundwater-bedrock environment relative to the deep environment was postulated to
result in upward movement of electrons through conductive mineralisation (Fig. 3-7). At
the surface of the conductor, oxidation of reducing agents in deeper areas provides
electrons to the conductor, allowing the simultaneous reduction of oxidising agents in