
Page 161 - Geochemical Remote Sensing of The Sub-Surface
P. 161
138 V.T. Jones, M.D. Matthews and D.M. Richers
1 - Liter Modified SOHNGEN Flask Nutrient Medlunl
Substrate Added NH4CI 1.0 g
K.z*O 4 1.og
Nutrient Added
e/
Autoclave MgSO 4 -7H20 0.5g
CaCI 2 0.5 g
Innoculate
Water 1000 ml
Incubate Deionlzed, Distilled,
& Degassed
Chromatographic
Analysis
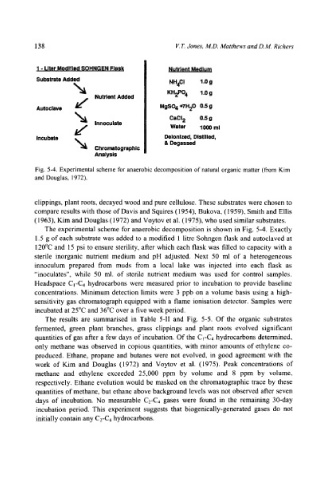
Fig. 5-4. Experimental scheme for anaerobic decomposition of natural organic matter (from Kim
and Douglas, 1972).
clippings, plant roots, decayed wood and pure cellulose. These substrates were chosen to
compare results with those of Davis and Squires (1954), Bukova, (1959), Smith and Ellis
(1963), Kim and Douglas (1972) and Voytov et al. (1975), who used similar substrates.
The experimental scheme for anaerobic decomposition is shown in Fig. 5-4. Exactly
1.5 g of each substrate was added to a modified 1 litre Sohngen flask and autoclaved at
120~ and 15 psi to ensure sterility, after which each flask was filled to capacity with a
sterile inorganic nutrient medium and pH adjusted. Next 50 ml of a heterogeneous
innoculum prepared from muds from a local lake was injected into each flask as
"inoculates", while 50 ml. of sterile nutrient medium was used for control samples.
Headspace C~-C4 hydrocarbons were measured prior to incubation to provide baseline
concentrations. Minimum detection limits were 3 ppb on a volume basis using a high-
sensitivity gas chromatograph equipped with a flame ionisation detector. Samples were
incubated at 25~ and 36~ over a five week period.
The results are summarised in Table 5-II and Fig. 5-5. Of the organic substrates
fermented, green plant branches, grass clippings and plant roots evolved significant
quantities of gas after a few days of incubation. Of the C~-C4 hydrocarbons determined,
only methane was observed in copious quantities, with minor amounts of ethylene co-
produced. Ethane, propane and butanes were not evolved, in good agreement with the
work of Kim and Douglas (1972) and Voytov et al. (1975). Peak concentrations of
methane and ethylene exceeded 25,000 ppm by volume and 8 ppm by volume,
respectively. Ethane evolution would be masked on the chromatographic trace by these
quantities of methane, but ethane above background levels was not observed after seven
days of incubation. No measurable C2-C4 gases were found in the remaining 30-day
incubation period. This experiment suggests that biogenically-generated gases do not
initially contain any C2-Ca hydrocarbons.