
Page 168 - Geochemical Remote Sensing of The Sub-Surface
P. 168
Light hydrocarbons for petroleum and gas prospecting 145
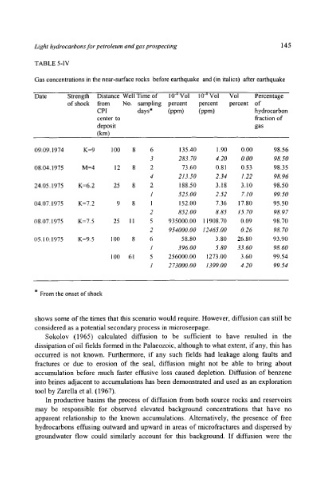
TABLE 5-IV
Gas concentrations in the near-surface rocks before earthquake and (in italics) after earthquake
Date Strength Distance Well Time of 10 4 Vol 10 -4 Vol Vol Percentage
of shock from No. sampling percent percent percent of
CPI days* (ppm) (ppm) hydrocarbon
center to fraction of
deposit gas
(km)
09.09.1974 K=9 100 8 6 135.40 1.90 0.00 98.56
3 283.70 4.20 0.00 98.50
08.04.1975 M=4 12 8 2 73.60 0.81 0.53 98.35
4 213.50 2.34 1.22 98.96
24.05.1975 K=6.2 25 8 2 188.50 3.18 3. ! 0 98.50
1 525.00 2.52 7.10 99.50
04.07.1975 K=7.2 9 8 1 152.00 7.36 17.80 95.50
2 852.00 8.85 15.70 98.97
08.07.1975 K=7.5 25 11 5 935000.00 11908.70 0.09 98.70
2 954000.00 12465.00 0.26 98.70
05.10.1975 K=9.5 100 8 6 58.80 3.80 26.80 93.90
1 396.00 5.80 33.60 98.60
100 61 5 256000.00 1273.00 3.60 99.54
! 273000.00 1399.00 4.20 99.54
:g
From the onset of shock
shows some of the times that this scenario would require. However, diffusion can still be
considered as a potential secondary process in microseepage.
Sokolov (1965) calculated diffusion to be sufficient to have resulted in the
dissipation of oil fields formed in the Palaeozoic, although to what extent, if any, this has
occurred is not known. Furthermore, if any such fields had leakage along faults and
fractures or due to erosion of the seal, diffusion might not be able to bring about
accumulation before much faster effusive loss caused depletion. Diffusion of benzene
into brines adjacent to accumulations has been demonstrated and used as an exploration
tool by Zarella et al. (1967).
In productive basins the process of diffusion from both source rocks and reservoirs
may be responsible for observed elevated background concentrations that have no
apparent relationship to the known accumulations. Alternatively, the presence of free
hydrocarbons effusing outward and upward in areas of microfractures and dispersed by
groundwater flow could similarly account for this background. If diffusion were the