
Page 169 - Geochemical Remote Sensing of The Sub-Surface
P. 169
146 V.T. Jones, M.D. Matthews and D.M. Richers
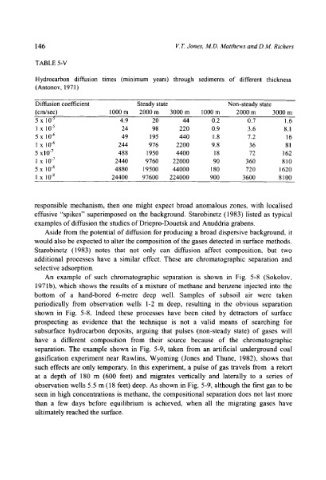
TABLE 5-V
Hydrocarbon diffusion times (minimum years) through sediments of different thickness
(Antonov, 1971 )
Diffusion coefficient Steady state Non-steady state
(crn/sec) 1000 m 2000 m 3000 m 1000 m 2000 m 3000 m
5 x 10 -5 4.9 20 44 0.2 0.7 1.6
1 x 10 .5 24 98 220 0.9 3.6 8. I
5 x 10 -6 49 195 440 1.8 7.2 16
1 x 10 .6 244 976 2200 9.8 36 81
5 x 10 .7 488 1950 4400 18 72 162
1 x 10 .7 2440 9760 22000 90 360 810
5 x 10 .8 4880 19500 44000 180 720 1620
1 x 10 -8 24400 97600 224000 900 3600 8100
responsible mechanism, then one might expect broad anomalous zones, with localised
effusive "spikes" superimposed on the background. Starobinetz (1983) listed as typical
examples of diffusion the studies of Driepro-Douetsk and Anuddria grabens.
Aside from the potential of diffusion for producing a broad dispersive background, it
would also be expected to alter the composition of the gases detected in surface methods.
Starobinetz (1983) notes that not only can diffusion affect composition, but two
additional processes have a similar effect. These are chromatographic separation and
selective adsorption.
An example of such chromatographic separation is shown in Fig. 5-8 (Sokolov,
197 lb), which shows the results of a mixture of methane and benzene injected into the
bottom of a hand-bored 6-metre deep well. Samples of subsoil air were taken
periodically from observation wells 1-2 m deep, resulting in the obvious separation
shown in Fig. 5-8. Indeed these processes have been cited by detractors of surface
prospecting as evidence that the technique is not a valid means of searching for
subsurface hydrocarbon deposits, arguing that pulses (non-steady state) of gases will
have a different composition from their source because of the chromatographic
separation. The example shown in Fig. 5-9, taken from an artificial underground coal
gasification experiment near Rawlins, Wyoming (Jones and Thune, 1982), shows that
such effects are only temporary. In this experiment, a pulse of gas travels from a retort
at a depth of 180 m (600 feet) and migrates vertically and laterally to a series of
observation wells 5.5 m (18 feet) deep. As shown in Fig. 5-9, although the first gas to be
seen in high concentrations is methane, the compositional separation does not last more
than a few days before equilibrium is achieved, when all the migrating gases have
ultimately reached the surface.