
Page 223 - Geochemical Remote Sensing of The Sub-Surface
P. 223
Light hydrocarbons jbr petroleum and gas prospecting 199
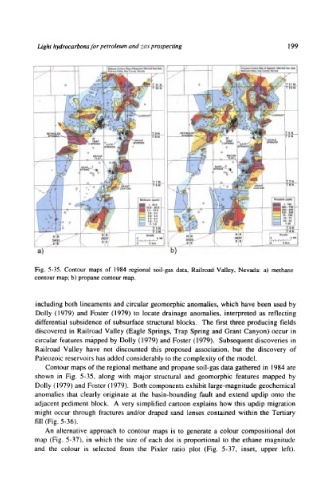
Fig. 5-35. Contour maps of 1984 regional soil-gas data, Railroad Valley, Nevada: a) methane
contour map; b) propane contour map.
including both lineaments and circular geomorphic anomalies, which have been used by
Dolly (1979) and Foster (1979) to locate drainage anomalies, interpreted as reflecting
differential subsidence of subsurface structural blocks. The first three producing fields
discovered in Railroad Valley (Eagle Springs, Trap Spring and Grant Canyon) occur in
circular features mapped by Dolly (1979) and Foster (1979). Subsequent discoveries in
Railroad Valley have not discounted this proposed association, but the discovery of
Paleozoic reservoirs has added considerably to the complexity of the model.
Contour maps of the regional methane and propane soil-gas data gathered in 1984 are
shown in Fig. 5-35, along with major structural and geomorphic features mapped by
Dolly (1979) and Foster (1979). Both components exhibit large-magnitude geochemical
anomalies that clearly originate at the basin-bounding fault and extend updip onto the
adjacent pediment block. A very simplified cartoon explains how this updip migration
might occur through fractures and/or draped sand lenses contained within the Tertiary
fill (Fig. 5-36).
An alternative approach to contour maps is to generate a colour compositional dot
map (Fig. 5-37), in which the size of each dot is proportional to the ethane magnitude
and the colour is selected from the Pixler ratio plot (Fig. 5-37, inset, upper left).