
Page 138 - Geochemistry of Oil Field Waters
P. 138
126 INTERPRETATION OF CHEMICAL ANALYSES
TABLE 4.1
Reaction coefficients
Cation Anion
Calcium 0.0499 bicarbonate 0.0164
Magnesium 0.0823 sulfate 0.0208
Iron 0.0358 chloride 0.0282
Sodium 0.0435
TABLE 4.11
Reacting values (RV)
Cation (mg/l) RV Anion (mg/l) RV
Ca 4,000 x 0.0499 = 199.6 HC03 500 x 0.0164 = 8.2
Mg 3,000 x 0.0823 = 246.8 so4 200 x 0.0208 = 4.2
Fe 100 x 0.0358 = 3.6 C1 30,000 x 0.0282 = 846.3
Na 9,400 x 0.0435 = 408.9
858.9 858.7
TABLE 4.111
Reacting value distribution
Ca as calcium bicarbonate 8.2
Ca as calcium sulfate 4.2
Ca as calcium chloride 187.2
Mg as magnesium chloride 246.8
Fe as iron chloride 3.6
Na as sodium chloride 408.9
858.9
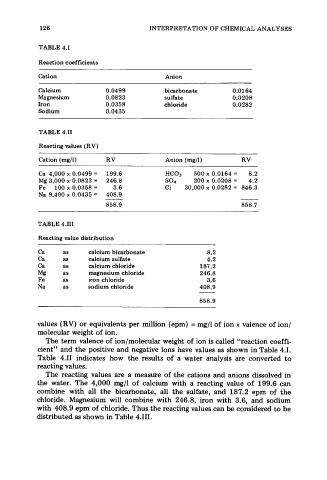
values (RV) or equivalents per million (epm) = mg/l of ion x valence of ion/
molecular weight of ion.
The term valence of ion/molecular weight of ion is called “reaction coeffi-
cient” and the positive and negative ions have values as shown in Table 4.1.
Table 4.11 indicates how the results of a water analysis are converted to
reacting values.
The reacting values are a measure of the cations and anions dissolved in
the water. The 4,000 mg/l of calcium with a reacting value of 199.6 can
combine with all the bicarbonate, all the sulfate, and 187.2 epm of the
chloride. Magnesium will combine with 246.8, iron with 3.6, and sodium
with 408.9 epm of chloride. Thus the reacting values can be considered to be
distributed as shown in Table 4.111.