
Page 143 - Geochemistry of Oil Field Waters
P. 143
GRAPHIC PLOTS 131
Reistle diagram
Reistle (1927) devised a method of plotting water analyses using the ion
concentrations as shown in Fig. 4.6. The data are plotted on a vertical
diagram, with the cations plotted above the central zero line and the anions
below. This type of diagram often is useful in making regional correlations or
studying lateral variations in the water of a single formation, because several
analyses can be plotted on a large sheet of paper.
St iff diagra m
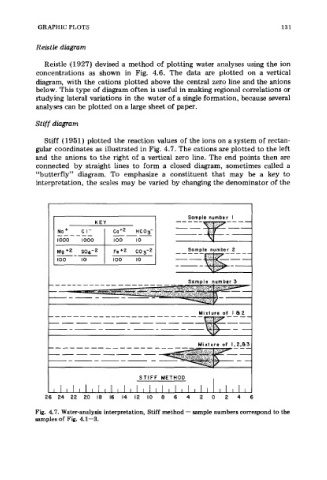
Stiff (1951) plotted the reaction values of the ions on a system of rectan-
gular coordinates as illustrated in Fig. 4.7. The cations are plotted to the left
and the anions to the right of a vertical zero line. The end points then are
connected by straight lines to form a closed diagram, sometimes called a
“butterfly” diagram. To emphasize a constituent that may be a key to
interpretation, the scales may be varied by changing the denominator of the
Fig. 4.7. Water-analysis interpretation, Stiff method - sample numbers correspond to the
samples of Fig. 4.1-3.