
Page 140 - Geochemistry of Oil Field Waters
P. 140
128 INTERPRETATION OF CHEMICAL ANALYSES
Graphic plots
Graphic plots of the reacting values can be made to illustrate the relative
amount of each radical present. The graphical presentation is an aid to rapid
identification of a water, and classification as to its type, and there are
several methods that have been developed.
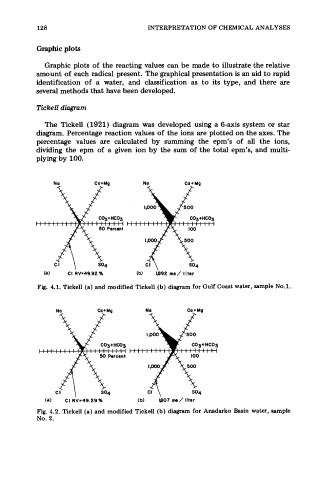
Tickell diagram
The Tickell (1921) diagram was developed using a 6-axis system or star
diagram. Percentage reaction values of the ions are plotted on the axes. The
percentage values are calculated by summing the epm’s of all the ions,
dividing the epm of a given ion by the sum of the total epm’s, and multi-
plying by 100.
Na Ca+Mg Na Ca+Mg
2-
ci \ So4
(a) CI RV=49.92% (b) h92 ma / I i tar
Fig. 4.1. Tickell (a) and modified Tickell (b) diagram for Gulf Coast water, sample No.1.
s
Na Ca+Mg Ca + Mg
(a) CI ~v=49.29% (b) 1i07 ma/ lltar
Fig. 4.2. Tickell (a) and modified Tickell (b) diagram for Anadarko Basin water, sample
No. 2.