
Page 142 - Geochemistry of Oil Field Waters
P. 142
130 INTERPRETATION OF CHEMICAL ANALYSES
Fig. 4.1. illustrates the Tickell diagram using reaction values in percentage
in the diagram on the left, and total reaction values in the diagram on the
right. The plots of total reaction values, rather than of percentage reaction
values, are often more useful in water identification because the percentage
values do not take into account the actual 'ion concentrations. Water dif-
fering only in concentrations of dissolved constituents cannot be distin-
guished.
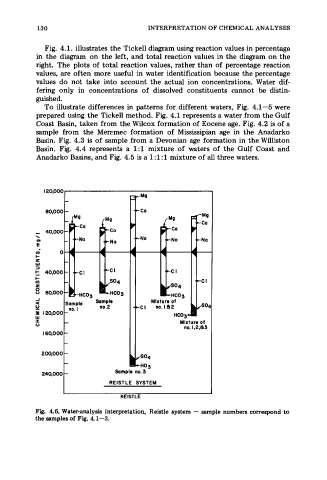
To illustrate differences in patterns for different waters, Fig. 4.1-5 were
prepared using the Tickell method. Fig. 4.1 represents a water from the Gulf
Coast Basin, taken from the Wilcox formation of Eocene age. Fig. 4.2 is of a
sample from the Mer?.mec formation of Mississipian age in the Anadarko
Basin. Fig. 4.3 is of sample from a Devonian age formation in the Williston
Basin. Fig. 4.4 represents a 1:l mixture of waters of the Gulf Coast and
Anadarko Basins, and Fig. 4.5 is a 1 : 1 : 1 mixture of all three waters.
REISTLE SYSTEM
Fig. 4.6. Water-analysis interpretation, Reistle system - sample numbers correspond to
the samples of Fig. 4.1-3.