
Page 245 - Geochemistry of Oil Field Waters
P. 245
RESEARCH STUDIES 229
from the bottom to the top of the depositional strata. These variations can
be attributed to inflow of fresh sea water during the deposition or subsequent
leaching after deposition. Rittenhouse (1967) developed a method to classify
oilfield waters based upon the bromide concentrations.
Fig. 7.4 is a log-log plot of chloride versus bromide concentrations for
some Louisiana oilfield waters. The T, C, and J on the figure refer to Terti-
ary, Cretaceous, and Jurassic, indicating the ages of the rocks from which the
waters were taken. The normal evaporite curve was plotted by using data
from Table 7.111. The data in the figure indicate that most of the Tertiary
waters are deficient in bromide when compared to an evaporite water,
whereas the Cretaceous and Jurassic waters are enriched in bromide (Collins,
1967).
The Tertiary waters contain dissolved halite, which accounts for their low
bromide concentration, while the waters that are enriched in bromide con-
tain bitterns or have leached bromide from sediments that were enriched in
bioconcentrated bromide.
The bromide content of oilfield brines can be used to distinguish between
brines that originated because of evaporation of sea water and those formed
by the dissolution of evaporite minerals. This can be done by using Fig. 7.4.
If the bromide concentration falls to the right of the normal evaporite curve,
the brine contains evaporated sea water, while if it falls to the left of the
curve, it contains dissolved evaporite minerals.
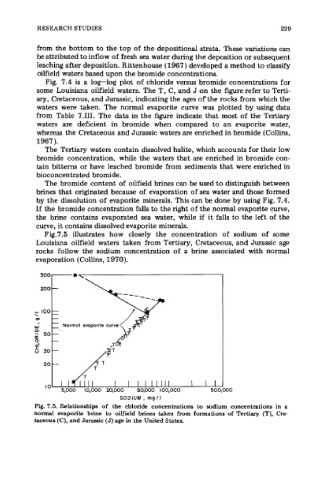
Fig.7.5 illustrates how closely the concentration of sodium of some
Louisiana oilfield waters taken from Tertiary, Cretaceous, and Jurassic age
rocks follow the sodium concentration of a brine associated with normal
evaporation (Collins, 1970).
300 0,
200
- 100
W Normal evaporite curve
50
0 -
J
20
'
lo 1
5,000 10,000 20,000 ' &bob I llob!OOO 500 300
SODIUM, mg/l
Fig. 7.5. Relationships of the chloride concentrations to sodium concentrations in a
normal evaporite brine to oilfield brines taken from formations of Tertiary (T), Cre-
taceous (C), and Jurassic (J) age in the United States,