
Page 241 - Geology of Carbonate Reservoirs
P. 241
222 SUMMARY: GEOLOGY OF CARBONATE RESERVOIRS
WEST EAST
AWTU 201 SC 1D SC 5 SM 1
gamma sonic gamma sonic gamma sonic gamma sonic
ST.LOUIS FM.
CHAPPEL FM.
datum : 6500 ft below s.l.
8000 8000 8000 8000
OSAGE FM.
0 7.5 80 60 40
radium equlv microsec. / foot
100 FEET
ELLENBURGER GP.
0 100 80 60 40 HORIZONTAL SCALE
0 1000 feet 0 7.5 80 60 40
API unit g microsec. / foot 0
radium equlv microsec. / foot
0 120 80 60 40
API unit g microsec. / foot
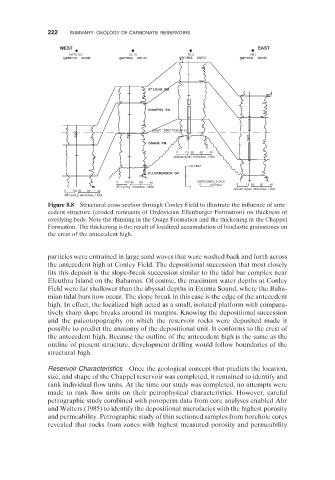
Figure 8.8 Structural cross section through Conley Field to illustrate the influence of ante-
cedent structure (eroded remnants of Ordovician Ellenburger Formation) on thickness of
overlying beds. Note the thinning in the Osage Formation and the thickening in the Chappel
Formation. The thickening is the result of localized accumulation of bioclastic grainstones on
the crest of the antecedent high.
particles were entrained in large sand waves that were washed back and forth across
the antecedent high at Conley Field. The depositional succession that most closely
fits this deposit is the slope - break succession similar to the tidal bar complex near
Eleuthra Island on the Bahamas. Of course, the maximum water depths at Conley
Field were far shallower than the abyssal depths in Exuma Sound, where the Baha-
mian tidal bars now occur. The slope break in this case is the edge of the antecedent
high. In effect, the localized high acted as a small, isolated platform with compara-
tively sharp slope breaks around its margins. Knowing the depositional succession
and the paleotopography on which the reservoir rocks were deposited made it
possible to predict the anatomy of the depositional unit. It conforms to the crest of
the antecedent high. Because the outline of the antecedent high is the same as the
outline of present structure, development drilling would follow boundaries of the
structural high.
Reservoir Characteristics Once the geological concept that predicts the location,
size, and shape of the Chappel reservoir was completed, it remained to identify and
rank individual flow units. At the time our study was completed, no attempts were
made to rank flow units on their petrophysical characteristics. However, careful
petrographic study combined with poroperm data from core analyses enabled Ahr
and Walters ( 1985 ) to identify the depositional microfacies with the highest porosity
and permeability. Petrographic study of thin sectioned samples from borehole cores
revealed that rocks from zones with highest measured porosity and permeability