
Page 136 - Geothermal Energy Renewable Energy and The Environment
P. 136
122 Geothermal Energy: Renewable Energy and the Environment
increased. Rather, the change indicates an improvement in the information available to conduct such
an analysis, and in the development of improved methods to carry them out. Similarly, the amount
of a commodity that can be identified as the resource can change with changes in the economic
environment. For example, deposits that could not be economically developed under one set of
market conditions may suddenly become economically attractive if the market price increases, as
often happens with gold or other metals. Technological improvements that reduce extraction costs
or that make it possible to economically develop a deposit or reservoir that was previously only mar-
ginally viable are also developments that can change estimates of the resource or the reserve. The
development of the high efficiency binary cycle generating systems (discussed in Chapter 9) are an
example of such a technological breakthrough that allowed the economic development of moderate
temperature geothermal reservoirs, thus changing both the reserve and the resource estimates for
geothermal power generation.
In the remainder of this chapter we will consider primarily the formal resource and how it is
estimated. In Chapter 14 we will discuss potential developments of technologies that might modify
the estimates generated using these methods.
esTablIshInG The reserVoIr VolUme
Equation 7.1 establishes the importance of accurately knowing the volume of a geothermal reservoir
in order to obtain an accurate estimate of the reservoir’s heat content. Geothermal reservoirs exist in
the subsurface at depths of hundreds to thousands of meters and it is thus difficult to obtain detailed
information about their geometry. In regions were a geothermal reservoir has been identified and
developed for use in power generation, there is often sufficient information available from drill holes
and production histories to support a relatively precise description of the three-dimensional geometry
of the subsurface temperature regime. But even then, substantial uncertainty can affect estimates of
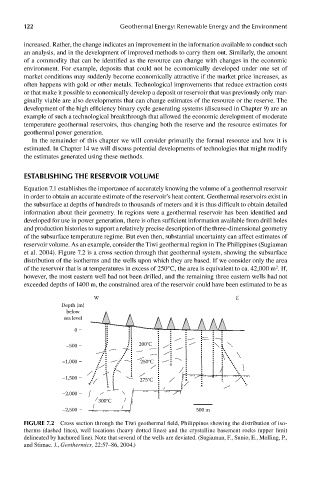
reservoir volume. As an example, consider the Tiwi geothermal region in The Philippines (Sugiaman
et al. 2004). Figure 7.2 is a cross section through that geothermal system, showing the subsurface
distribution of the isotherms and the wells upon which they are based. If we consider only the area
2
of the reservoir that is at temperatures in excess of 250°C, the area is equivalent to ca. 42,000 m . If,
however, the most eastern well had not been drilled, and the remaining three eastern wells had not
exceeded depths of 1400 m, the constrained area of the reservoir could have been estimated to be as
W E
Depth (m)
below
sea level
0
–500 200°C
–1,000 250°C
–1,500 275°C
–2,000
300°C
–2,500 500 m
FIGUre 7.2 Cross section through the Tiwi geothermal field, Philippines showing the distribution of iso-
therms (dashed lines), well locations (heavy dotted lines) and the crystalline basement rocks (upper limit
delineated by hachured line). Note that several of the wells are deviated. (Sugiaman, F., Sunio, E., Molling, P.,
and Stimac. J., Geothermics, 22:57–86, 2004.)