
Page 217 - Geothermal Energy Renewable Energy and The Environment
P. 217
Direct Use of Geothermal Resources 205
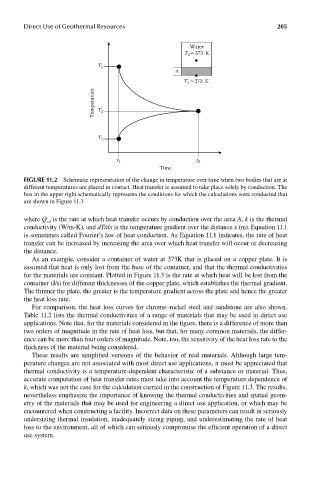
Water
T 2 = 373 K
T 2
x
T 1 = 273 K
Temperature T 3
T 1
t 1 t 2
Time
FIGUre 11.2 Schematic representation of the change in temperature over time when two bodies that are at
different temperatures are placed in contact. Heat transfer is assumed to take place solely by conduction. The
box in the upper right schematically represents the conditions for which the calculations were conducted that
are shown in Figure 11.3.
where Q is the rate at which heat transfer occurs by conduction over the area A, k is the thermal
cd
conductivity (W/m-K), and dT/dx is the temperature gradient over the distance x (m). Equation 11.1
is sometimes called Fourier’s law of heat conduction. As Equation 11.1 indicates, the rate of heat
transfer can be increased by increasing the area over which heat transfer will occur or decreasing
the distance.
As an example, consider a container of water at 373K that is placed on a copper plate. It is
assumed that heat is only lost from the base of the container, and that the thermal conductivities
for the materials are constant. Plotted in Figure 11.3 is the rate at which heat will be lost from the
container (J/s) for different thicknesses of the copper plate, which establishes the thermal gradient.
The thinner the plate, the greater is the temperature gradient across the plate and hence the greater
the heat loss rate.
For comparison, the heat loss curves for chrome–nickel steel and sandstone are also shown.
Table 11.2 lists the thermal conductivities of a range of materials that may be used in direct use
applications. Note that, for the materials considered in the figure, there is a difference of more than
two orders of magnitude in the rate of heat loss, but that, for many common materials, the differ-
ence can be more than four orders of magnitude. Note, too, the sensitivity of the heat loss rate to the
thickness of the material being considered.
These results are simplified versions of the behavior of real materials. Although large tem-
perature changes are not associated with most direct use applications, it must be appreciated that
thermal conductivity is a temperature-dependent characteristic of a substance or material. Thus,
accurate computation of heat transfer rates must take into account the temperature dependence of
k, which was not the case for the calculation carried in the construction of Figure 11.3. The results,
nevertheless emphasize the importance of knowing the thermal conductivities and spatial geom-
etry of the materials that may be used for engineering a direct use application, or which may be
encountered when constructing a facility. Incorrect data on these parameters can result in seriously
undersizing thermal insulation, inadequately sizing piping, and underestimating the rate of heat
loss to the environment, all of which can seriously compromise the efficient operation of a direct
use system.