
Page 277 - Geothermal Energy Systems Exploration, Development, and Utilization
P. 277
5.3 Reservoir Characterization 253
0.085 5.2
5.0
0.082
4.8
f 0.079
Porosity 4.6 Permeability k (10 −17 m 2 )
0.076
4.4
Measured permeability
Calculated permeability
0.073
Measured porosity 4.2
Calculated porosity
0.070 4.0
0 5 10 15 20 25 30 35 40
Effective pressure p eff (MPa)
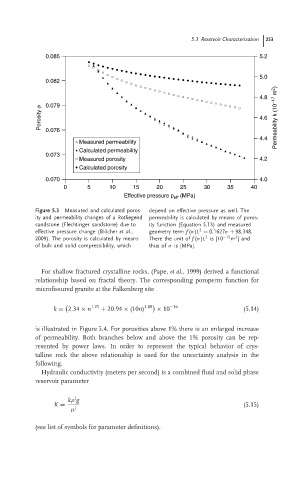
Figure 5.3 Measured and calculated poros- depend on effective pressure as well. The
ity and permeability changes of a Rotliegend permeability is calculated by means of poros-
sandstone (Flechtinger sandstone) due to ity function (Equation 5.13) and measured
..
2
effective pressure change (Blocher et al., geometry term f (σ)L = 0.1627σ + 98.348.
2
2
2009). The porosity is calculated by means There the unit of f (σ)L is [10 −15 m ]and
of bulk and solid compressibility, which thus of σ is [MPa].
For shallow fractured crystalline rocks, (Pape, et al., 1999) derived a functional
relationship based on fractal theory. The corresponding poroperm function for
microfissured granite at the Falkenberg site
1.25 3.88 −16
k = 2.34 × n + 20.94 × (10n) × 10 (5.14)
is illustrated in Figure 5.4. For porosities above 1% there is an enlarged increase
of permeability. Both branches below and above the 1% porosity can be rep-
resented by power laws. In order to represent the typical behavior of crys-
talline rock the above relationship is used for the uncertainty analysis in the
following.
Hydraulic conductivity (meters per second) is a combined fluid and solid phase
reservoir parameter
l
kρ g
K = l (5.15)
µ
(see list of symbols for parameter definitions).