
Page 278 - Geothermal Energy Systems Exploration, Development, and Utilization
P. 278
254 5 Geothermal Reservoir Simulation
1.0 × 10 −14
1.0 × 10 −15
Permeability (m 2 ) 1.0 × 10 −16
−17
1.0 × 10
1.0 × 10 −18
1.0 × 10 −19
1.0 × 10 −20
0.1 1 10
Porosity (%)
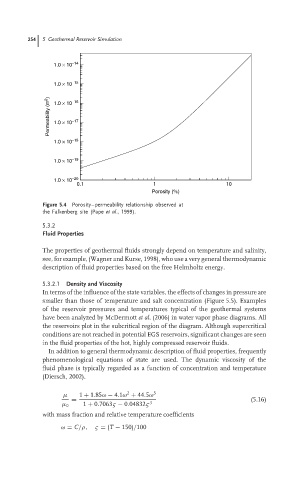
Figure 5.4 Porosity–permeability relationship observed at
the Falkenberg site (Pape et al., 1999).
5.3.2
Fluid Properties
The properties of geothermal fluids strongly depend on temperature and salinity,
see, for example, (Wagner and Kurse, 1998), who use a very general thermodynamic
description of fluid properties based on the free Helmholtz energy.
5.3.2.1 Density and Viscosity
In terms of the influence of the state variables, the effects of changes in pressure are
smaller than those of temperature and salt concentration (Figure 5.5). Examples
of the reservoir pressures and temperatures typical of the geothermal systems
have been analyzed by McDermott et al. (2006) in water vapor phase diagrams. All
the reservoirs plot in the subcritical region of the diagram. Although supercritical
conditions are not reached in potential EGS reservoirs, significant changes are seen
in the fluid properties of the hot, highly compressed reservoir fluids.
In addition to general thermodynamic description of fluid properties, frequently
phenomenological equations of state are used. The dynamic viscosity of the
fluid phase is typically regarded as a function of concentration and temperature
(Diersch, 2002).
2
µ 1 + 1.85ω − 4.1ω + 44.5ω 3
= (5.16)
µ 0 1 + 0.7063ς − 0.04832ς 3
with mass fraction and relative temperature coefficients
ω = C/ρ, ς = (T − 150)/100