
Page 315 - Geothermal Energy Systems Exploration, Development, and Utilization
P. 315
5.10 Stralsund (Germany) 291
assumed period of operation of the geothermal heating plant is 80 years. Changes
in porosity can be calculated without difficulty from the reaction rates of the mineral
components knowing their molar volumes. However, it is not as straightforward to
estimate the associated changes in permeability because permeability depends not
only on the bulk porosity but also strongly on the structure of the pore space. We
applied the so-called ‘‘pigeon hole’’ model especially suited for sedimentary rocks
of (Pape et al., 1999). This model yields petrophysically justified relations between
the various geometric, storage, and transport parameters of these reservoir rocks.
Like other fractal models, it is based on the observation that the shape of the
internal surface of rock pores follows a self-similar rule.
5.10.3
Long-Term Development of Reservoir Properties
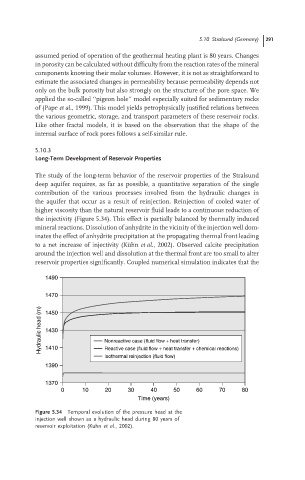
The study of the long-term behavior of the reservoir properties of the Stralsund
deep aquifer requires, as far as possible, a quantitative separation of the single
contribution of the various processes involved from the hydraulic changes in
the aquifer that occur as a result of reinjection. Reinjection of cooled water of
higher viscosity than the natural reservoir fluid leads to a continuous reduction of
the injectivity (Figure 5.34). This effect is partially balanced by thermally induced
mineral reactions. Dissolution of anhydrite in the vicinity of the injection well dom-
inates the effect of anhydrite precipitation at the propagating thermal front leading
to a net increase of injectivity (K¨ uhn et al., 2002). Observed calcite precipitation
around the injection well and dissolution at the thermal front are too small to alter
reservoir properties significantly. Coupled numerical simulation indicates that the
1490
1470
Hydraulic head (m) 1450 Nonreactive case (fluid flow + heat transfer)
1430
1410
Reactive case (fluid flow + heat transfer + chemical reactions)
Isothermal reinjection (fluid flow)
1390
1370
0 10 20 30 40 50 60 70 80
Time (years)
Figure 5.34 Temporal evolution of the pressure head at the
injection well shown as a hydraulic head during 80 years of
reservoir exploitation (K¨ uhn et al., 2002).