Page 312 - Geothermal Energy Systems Exploration, Development, and Utilization
P. 312

288  5 Geothermal Reservoir Simulation

                                Erbendorf
                                                                                 Erbendorf
                                         Core of shear zone
                           2000 m             Damage area of shear zone −35
                         Depth below ground level (m)  4000 m  Open  SE2a
                                                             Head (m)
                                                               −50
                                                               −80
                                   hole


                           6000 m        North 2000 m           SE2
                                South
                                        0                        SE1a
                                  −2000 m                                                  West
                                  −2000 m
                                   West     0                                             East
                                                                      South           North
                                                  2000 m
                                                  West
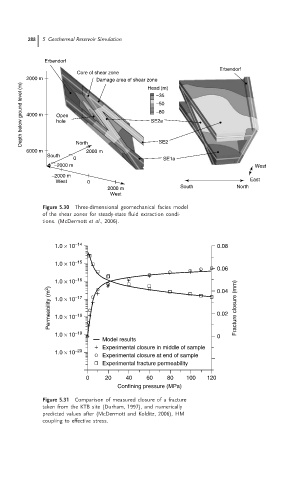
                               Figure 5.30  Three-dimensional geomechanical facies model
                               of the shear zones for steady-state fluid extraction condi-
                               tions. (McDermott et al., 2006).


                                   1.0 × 10 −14                                  0.08

                                   1.0 × 10 −15
                                                                                 0.06
                                   1.0 × 10 −16                                  0.04
                                 Permeability (m 2 )  1.0 × 10 −17               0.02 Fracture closure (mm)


                                        −18
                                   1.0 × 10

                                   1.0 × 10 −19                                  0
                                                Model results
                                                Experimental closure in middle of sample
                                   1.0 × 10 −20
                                                Experimental closure at end of sample
                                                Experimental fracture permeability

                                           0     20    40    60   80    100   120
                                                    Confining pressure (MPa)
                               Figure 5.31  Comparison of measured closure of a fracture
                               taken from the KTB site (Durham, 1997), and numerically
                               predicted values after (McDermott and Kolditz, 2006), HM
                               coupling to effective stress.
   307   308   309   310   311   312   313   314   315   316   317