
Page 122 - Global Tectonics
P. 122
THE FRAMEWORK OF PLATE TECTONICS 109
Sella et al. (2002) provided a comprehensive review to real changes in relative velocities over the past few
of the determinations of relative plate velocities, using million years. Examples of the latter include Arabia-
the techniques of space geodesy, up to the year 2000. Eurasia and India-Eurasia, which may well refl ect
Most of the data summarized were obtained by the long term deceleration associated with continental
GPS method after 1992, when the system was upgraded collision.
and the accuracy greatly improved. They presented a Most of the space geodetic data points in stable plate
model for recent relative plate velocities (REVEL- interiors confirm the rigidity of plates and hence the
2000), based on this data, that involves 19 plates. The rigid plate assumption of plate tectonics. Of the major
velocities obtained for numerous plate pairs within this plates the only exception to this generalization is the
model were then compared with those predicted Australian plate.
by the “geologic” model for current plate motions These techniques of direct measurement are clearly
(NUVEL-1A) that averages plate velocities over the past extremely important in that they provide estimates of
3 Ma (DeMets et al., 1990, 1994). The velocities for two- relative plate movements that are independent of plate
thirds of the plate pairs tested were in very close agree- tectonic models. It is probable that their accuracy will
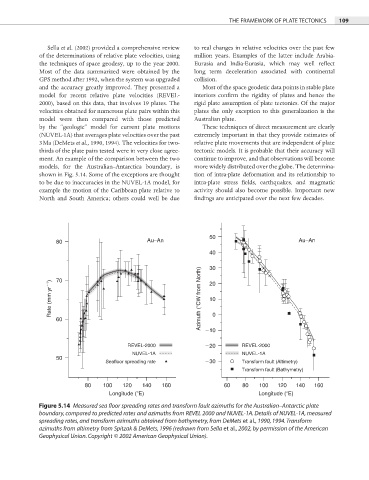
ment. An example of the comparison between the two continue to improve, and that observations will become
models, for the Australian–Antarctica boundary, is more widely distributed over the globe. The determina-
shown in Fig. 5.14. Some of the exceptions are thought tion of intra-plate deformation and its relationship to
to be due to inaccuracies in the NUVEL-1A model, for intra-plate stress fields, earthquakes, and magmatic
example the motion of the Caribbean plate relative to activity should also become possible. Important new
North and South America; others could well be due findings are anticipated over the next few decades.
50
80 Au–An Au–An
40
30
Rate (mm yr 1 ) 70 Azimuth ( CW from North) 20
10
60 10 0
REVEL-2000 20 REVEL-2000
NUVEL-1A NUVEL-1A
50
Seafloor spreading rate 30 Transform fault (Altimetry)
Transform fault (Bathymetry)
80 100 120 140 160 60 80 100 120 140 160
Longitude ( E) Longitude ( E)
Figure 5.14 Measured sea floor spreading rates and transform fault azimuths for the Australian–Antarctic plate
boundary, compared to predicted rates and azimuths from REVEL 2000 and NUVEL-1A. Details of NUVEL-1A, measured
spreading rates, and transform azimuths obtained from bathymetry, from DeMets et al., 1990, 1994. Transform
azimuths from altimetry from Spitzak & DeMets, 1996 (redrawn from Sella et al., 2002, by permission of the American
Geophysical Union. Copyright © 2002 American Geophysical Union).