
Page 204 - Global Tectonics
P. 204
190 CHAPTER 7
Rift axis Mantle Crust
dominated Transitional dominated
(a) (e) 22
Crust
20
Depth ∂z/∂x 700 C 18 Strong crust
Rift half-width (km) 14 Intermediate
16
12
Mantle crust
Rift half-width 10
8
6
Weak crust
(b) 0 4
5 C 2 0 5 10 15 20 25 30 35 40
M
10
Depth (km) 15 Mantle - dominated Crustal thickness (km)
20
25
T c 6 km Mantle Crust
30 (f) dominated dominated
30 20 10 0 10 20 30 40
∂T (x 0) 25 K km 1
(c) 0 ∂z
35 Cold
5
Strong Crust
10
Depth (km) 15 M 30 35 K km 1 Intermediate Crust
C
20
25 25
T c 12 km
30 Rift half-width (km) 20 46 K km 1
30 20 10 0 10 20 30
(d) 0 15 70 K km 1
5
10
Depth (km) 15 Crust - dominated 10 5 140 K km 1
20
25 C T c 27 km Warm
30 M 0
30 20 10 0 10 20 30 0 5 10 15 20 25 30 35 40
Across axis distance (km) Crustal thickness (km)
0 100 200 2 0 2
τ max(MPa) Log 10 strain rate
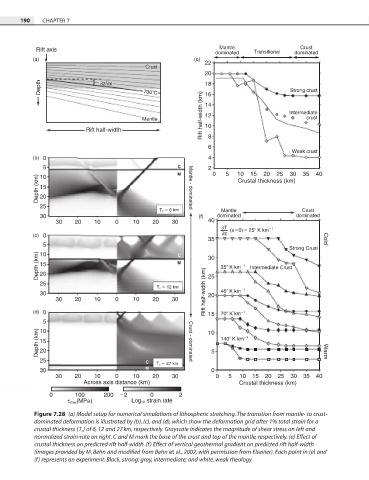
Figure 7.28 (a) Model setup for numerical simulations of lithospheric stretching. The transition from mantle- to crust-
dominated deformation is illustrated by (b), (c), and (d), which show the deformation grid after 1% total strain for a
crustal thickness (T c ) of 6, 12 and 27 km, respectively. Grayscale indicates the magnitude of shear stress on left and
normalized strain-rate on right. C and M mark the base of the crust and top of the mantle, respectively. (e) Effect of
crustal thickness on predicted rift half-width. (f) Effect of vertical geothermal gradient on predicted rift half-width
(images provided by M. Behn and modified from Behn et al., 2002, with permission from Elsevier). Each point in (e) and
(f) represents an experiment. Black, strong; gray, intermediate; and white, weak rheology.