Page 209 - Global Tectonics
P. 209

CONTINENTAL RIFTS AND RIFTED MARGINS  195


                                             COB
              (a)  NW                                                                         SE
                0       1.95   2.45
                      5.15            5.0           5.2  4.5    6.0              6.0
               10      6.9           6.7            6.0         6.4
                                     7.2            6.4                          6.4
                                                    7.2
                                     8.1            8.2         6.8
              km  20                                                        6.8
                                          SDR                   8.2         8.2
               30
                                  OCEAN–CONTINENT TRANSITION ZONE
                                                                                        V.E.= 3x
               40
                  0         50        100       150       200        250       300       350  km

              (b)
                 0        50      100       150     200       250     300      350      400   km
              150
                                                                                  Gravity anomaly
              100
               50
              mGal  0
               50      observed
                      calculated
              100
              150


                         Cenozoic and                                 Cretaceous
              (c)        glacial sediment  COB  Volcanic layers       sediment
                 NW                              and SDR                                       SE
               0
                   2050        2200                                   2400    2450
                                                                      2500
                                                                      2500
                                                                            2550
                                                            2450
                                                            2450      2500  2550
                                                            2450
                                                                            2550
                                  2650
                                  2650
                          2800    2650         2550                2600                Continental
                         2900
                         2900
               10        2900                                           2850                crust
                                    3000
                                    3000
                                    3000                    2790
                                                                                      2790
                    Oceanic crust   3200                                2900
                                                                        2900
                                                                        2900
             km  20
                                         High velocity
                                        lower crustal body
               30
                                                            High density
                                                           continental crust
                                                                                     V.E. = 3x
               40
                 0        50       100      150      200      250      300      350      400   km
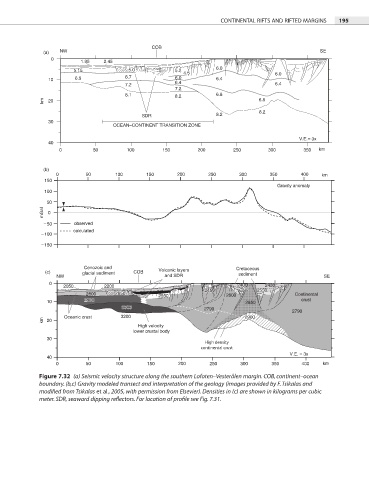
            Figure 7.32  (a) Seismic velocity structure along the southern Lofoten–Vesterålen margin. COB, continent–ocean
            boundary. (b,c) Gravity modeled transect and interpretation of the geology (images provided by F. Tsikalas and
            modifi ed from Tsikalas et al., 2005, with permission from Elsevier). Densities in (c) are shown in kilograms per cubic
            meter. SDR, seaward dipping reflectors. For location of profile see Fig. 7.31.
   204   205   206   207   208   209   210   211   212   213   214