
Page 205 - Global Tectonics
P. 205
CONTINENTAL RIFTS AND RIFTED MARGINS 191
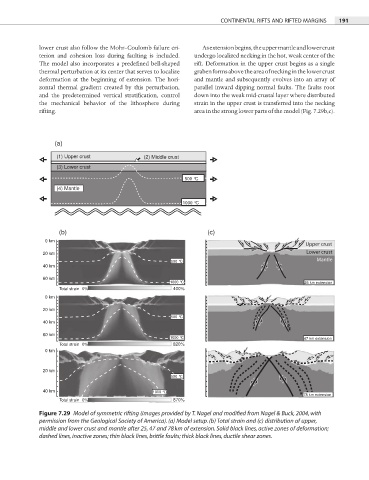
lower crust also follow the Mohr–Coulomb failure cri- As extension begins, the upper mantle and lower crust
terion and cohesion loss during faulting is included. undergo localized necking in the hot, weak center of the
The model also incorporates a predefi ned bell-shaped rift. Deformation in the upper crust begins as a single
thermal perturbation at its center that serves to localize graben forms above the area of necking in the lower crust
deformation at the beginning of extension. The hori- and mantle and subsequently evolves into an array of
zontal thermal gradient created by this perturbation, parallel inward dipping normal faults. The faults root
and the predetermined vertical stratifi cation, control down into the weak mid-crustal layer where distributed
the mechanical behavior of the lithosphere during strain in the upper crust is transferred into the necking
rifting. area in the strong lower parts of the model (Fig. 7.29b,c).
(a)
(1) Upper crust (2) Middle crust
(3) Lower crust
500 °C
(4) Mantle
1000 °C
(b) (c)
0 km
Upper crust
20 km Lower crust
Mantle
500 °C
40 km
60 km
1000 °C 25 km extension
Total strain 0% 400%
0 km
20 km
500 °C
40 km
60 km
1000 °C 47 km extension
Total strain 0% 820%
0 km
20 km
500 °C
40 km 1000 °C
78 km extension
Total strain 0% 870%
Figure 7.29 Model of symmetric rifting (images provided by T. Nagel and modified from Nagel & Buck, 2004, with
permission from the Geological Society of America). (a) Model setup. (b) Total strain and (c) distribution of upper,
middle and lower crust and mantle after 25, 47 and 78 km of extension. Solid black lines, active zones of deformation;
dashed lines, inactive zones; thin black lines, brittle faults; thick black lines, ductile shear zones.