
Page 239 - Global Tectonics
P. 239
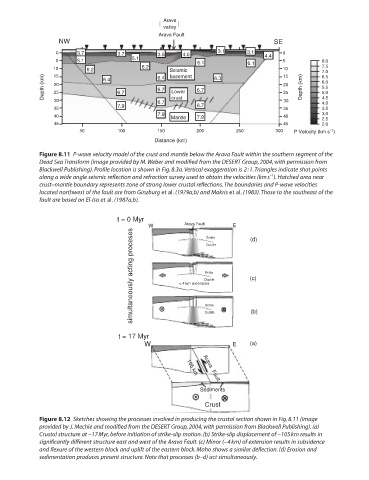
Arava
                                                valley
                                               Arava Fault
                  NW                                                             SE
                 0     3.7         3.7         3.5    4.0       3.1      3.1  4.4  0
                 5     5.1             5.1                6.1            6.1       5          8.0
                 10       6.2             6.2     Seismic                          10         7.5
                                                                                              7.0
                 15
                                                                                              6.5
                                                  basement
                                                                                   15
              Depth (km)  20   6.4  6.7        6.4  Lower  6.7  6.3                20    Depth (km)  6.0
                                                                                              5.5
                                               6.7
                 25
                                                                                              5.0
                                                                                   25
                 30
                                                                                              4.0
                                   7.9         6.7  crust  6.7                     30         4.5
                 35                                                                35         3.5
                 40                            7.9  Mantle  7.9                    40         3.0
                                                                                              2.5
                 45                                                                45         2.0
                        50         100         150        200         250        300  P Velocity (km s )
                                                                                                 -1
                                              Distance (km)
            Figure 8.11  P-wave velocity model of the crust and mantle below the Arava Fault within the southern segment of the
            Dead Sea Transform (image provided by M. Weber and modified from the DESERT Group, 2004, with permission from


            Blackwell Publishing). Profile location is shown in Fig. 8.3a. Vertical exaggeration is 2 : 1. Triangles indicate shot points
                                                                               −1
            along a wide angle seismic reflection and refraction survey used to obtain the velocities (km s ). Hatched area near

            crust–mantle boundary represents zone of strong lower crustal reflections. The boundaries and P-wave velocities

            located northwest of the fault are from Ginzburg et al. (1979a,b) and Makris et al. (1983). Those to the southeast of the
            fault are based on El-Isa et al. (1987a,b).
                                   t = 0 Myr
                                            W          Arava Fault  Ductile  E  (d)
                                       simultaneously acting proceses  < 4 km extension  (c)
                                                             Brittle
                                                            Brittle
                                                            Ductile


                                                             Brittle


                                   t = 17 Myr               Ductile       (b)
                                           W                Arava    E    (a)


                                                       105 km
                                                              Fault
                                                           Sediments

                                                            Crust

            Figure 8.12  Sketches showing the processes involved in producing the crustal section shown in Fig. 8.11 (image
            provided by J. Mechie and modified from the DESERT Group, 2004, with permission from Blackwell Publishing). (a)

            Crustal structure at ∼17 Myr, before initiation of strike-slip motion. (b) Strike-slip displacement of ∼105 km results in
            significantly different structure east and west of the Arava Fault. (c) Minor (∼4 km) of extension results in subsidence


            and flexure of the western block and uplift of the eastern block. Moho shows a similar deflection. (d) Erosion and
            sedimentation produces present structure. Note that processes (b–d) act simultaneously.