
Page 240 - Global Tectonics
P. 240
226 CHAPTER 8
America (Fig. 5.28a, Section 5.11). The fault joins the that are higher by ∼550 K between 30 and 50 km depth
Mendocino Triple Junction with the Gulf of California (Henstock & Levander, 2000).
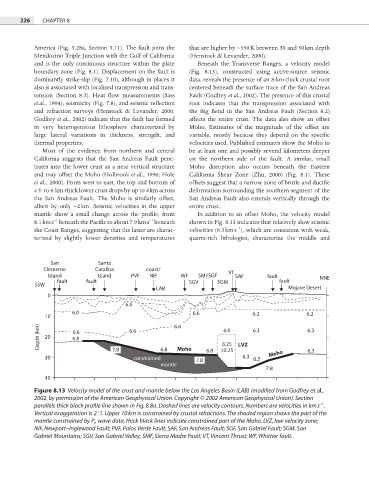
and is the only continuous structure within the plate Beneath the Transverse Ranges, a velocity model
boundary zone (Fig. 8.1). Displacement on the fault is (Fig. 8.13), constructed using active-source seismic
dominantly strike-slip (Fig. 7.10), although in places it data, reveals the presence of an 8-km-thick crustal root
also is associated with localized transpression and trans- centered beneath the surface trace of the San Andreas
tension (Section 8.2). Heat flow measurements (Sass Fault (Godfrey et al., 2002). The presence of this crustal
et al., 1994), seismicity (Fig. 7.8), and seismic refl ection root indicates that the transpression associated with
and refraction surveys (Henstock & Levander, 2000; the Big Bend in the San Andreas Fault (Section 8.2)
Godfrey et al., 2002) indicate that the fault has formed affects the entire crust. The data also show an offset
in very heterogeneous lithosphere characterized by Moho. Estimates of the magnitude of the offset are
large lateral variations in thickness, strength, and variable, mostly because they depend on the specifi c
thermal properties. velocities used. Published estimates show the Moho to
Most of the evidence from northern and central be at least one and possibly several kilometers deeper
California suggests that the San Andreas Fault pene- on the northern side of the fault. A similar, small
trates into the lower crust as a near vertical structure Moho disruption also occurs beneath the Eastern
and may offset the Moho (Holbrook et al., 1996; Hole California Shear Zone (Zhu, 2000) (Fig. 8.1). These
et al., 2000). From west to east, the top and bottom of offsets suggest that a narrow zone of brittle and ductile
a 5- to 6-km-thick lower crust drops by up to 4 km across deformation surrounding the southern segment of the
the San Andreas Fault. The Moho is similarly offset, San Andreas Fault also extends vertically through the
albeit by only ∼2 km. Seismic velocities in the upper entire crust.
mantle show a small change across the profi le, from In addition to an offset Moho, the velocity model
−1
−1
8.1 km s beneath the Pacifi c to about 7.9 km s beneath shown in Fig. 8.13 indicates that relatively slow seismic
−1
the Coast Ranges, suggesting that the latter are charac- velocities (6.3 km s ), which are consistent with weak,
terized by slightly lower densities and temperatures quartz-rich lithologies, characterize the middle and
San Santa
Clemente Catalina coast/
Island Island PVF NIF WF SMF SGF VT SAF fault NNE
fault fault SGV SGM fault
SSW
LAB Mojave Desert
0
6.0
6.0 6.6 6.2 6.2
10 6.6
Depth (km) 20 6.8 6.6 6.25 LVZ 6.3 6.3
6.0
6.6
30 7.8 constrained 6.8 Moho 7.8 6.8 ±0.25 6.3 6.3 Moho 6.3
mantle
7.8
40
Figure 8.13 Velocity model of the crust and mantle below the Los Angeles Basin (LAB) (modified from Godfrey et al.,
2002, by permission of the American Geophysical Union. Copyright © 2002 American Geophysical Union). Section
−1
parallels thick black profile line shown in Fig. 8.8a. Dashed lines are velocity contours. Numbers are velocities in km s .
Vertical exaggeration is 2 : 1. Upper 10 km is constrained by crustal refractions. The shaded region shows the part of the
mantle constrained by P n wave data, thick black lines indicate constrained part of the Moho. LVZ, low velocity zone;
NIF, Newport–Inglewood Fault; PVF, Palos Verde Fault; SAF, San Andreas Fault; SGF, San Gabriel Fault; SGM, San
Gabriel Mountains; SGV, San Gabriel Valley; SMF, Sierra Madre Fault; VT, Vincent Thrust; WF, Whittier fault.