
Page 243 - Global Tectonics
P. 243
CONTINENTAL TRANSFORMS AND STRIKE-SLIP FAULTS 229
the Canterbury Plain to a maximum depth of 37 km Below the crustal root, teleseismic data show that
below a point located 45 km southeast of the surface deformation becomes progressively wider with depth.
trace of the Alpine Fault. The root is asymmetric and Measurements of P n wave speeds (Scherwath et al.,
mimics the tapered profile of the Southern Alps at the 2002; Baldock & Stern, 2005) and shear wave (SKS) split-
surface: Moho depths southeast of the fault decrease ting (Klosko et al., 1999; Duclos et al., 2005) suggest the
more gradually than those on its northwest side presence of a zone of distributed ductile deformation
(Scherwath et al., 2003; Henrys et al., 2004). The root is in the upper mantle beneath the Alpine Fault. Fast
composed mostly of thickened upper crust with seismic polarization directions generally are oriented subparal-
−1
velocities ranging between 5.7 and 6.2 km s (Scher- lel to the fault strike (Fig. 8.15), suggesting fl ow parallel
wath et al., 2003; Van Avendonk et al., 2004). At large to the plate boundary. Baldock & Stern (2005) found
distances from the plate boundary, the upper crust evidence for two distinctive domains beneath the South
shows a normal thickness of ∼15 km. A thin (3–5 km) Island: a 335-km-wide zone of mantle deformation in
−1
lower crust with a velocity range of 6.5–7.1 km s the south and a narrower, ∼200-km-wide zone in the
occurs at the base of the root. A low velocity zone north (Fig. 8.15). These widths and the orientation of
occurs in the middle and lower crust below the fault the mantle anisotropy are consistent with a model of
trace, most likely as a result of high fl uid pressure transpression involving 800 ± 200 km of right lateral
(Section 8.6.3) (Stern et al., 2001, 2002), and extends strike-slip displacement, which is close to that predicted
downward into the upper mantle. by geologic reconstructions.
166° E 168° 42° 170° 40° 171° E
N
Western limit to deformation
+
11.5 2.4% 40° S
-
173° E
AF
k
175° E
T3
+
6.5 2.5% 0 3% 42° S
+
-
-
Eastern limit to deformation T1 100 km
T2
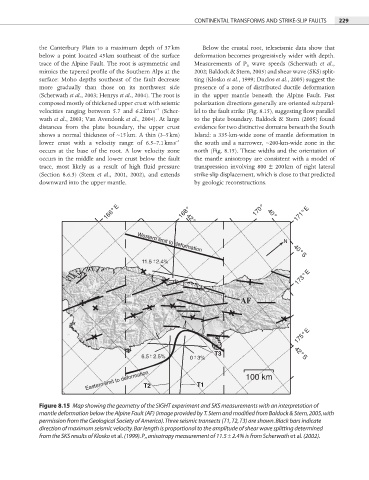
Figure 8.15 Map showing the geometry of the SIGHT experiment and SKS measurements with an interpretation of
mantle deformation below the Alpine Fault (AF) (image provided by T. Stern and modified from Baldock & Stern, 2005, with
permission from the Geological Society of America). Three seismic transects (T1, T2, T3) are shown. Black bars indicate
direction of maximum seismic velocity. Bar length is proportional to the amplitude of shear wave splitting determined
from the SKS results of Klosko et al. (1999). P n anisotropy measurement of 11.5 ± 2.4% is from Scherwath et al. (2002).