
Page 103 - Glucose Monitoring Devices
P. 103
102 CHAPTER 5 Modeling the SMBG measurement error
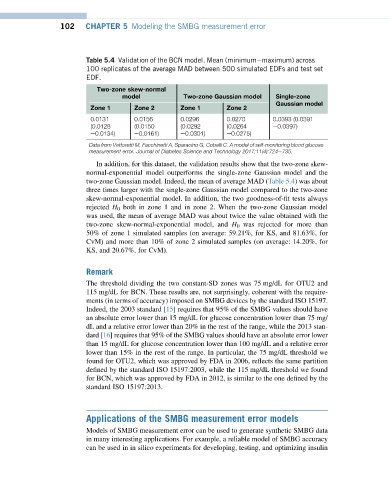
Table 5.4 Validation of the BCN model. Mean (minimumemaximum) across
100 replicates of the average MAD between 500 simulated EDFs and test set
EDF.
Two-zone skew-normal
model Two-zone Gaussian model Single-zone
Gaussian model
Zone 1 Zone 2 Zone 1 Zone 2
0.0131 0.0156 0.0296 0.0270 0.0393 (0.0391
(0.0128 (0.0150 (0.0292 (0.0264 e0.0397)
e0.0134) e0.0161) e0.0301) e0.0275)
Data from Vettoretti M, Facchinetti A, Sparacino G, Cobelli C. A model of self-monitoring blood glucose
measurement error. Journal of Diabetes Science and Technology 2017;11(4):724e735.
In addition, for this dataset, the validation results show that the two-zone skew-
normal-exponential model outperforms the single-zone Gaussian model and the
two-zone Gaussian model. Indeed, the mean of average MAD (Table 5.4) was about
three times larger with the single-zone Gaussian model compared to the two-zone
skew-normal-exponential model. In addition, the two goodness-of-fit tests always
rejected H 0 both in zone 1 and in zone 2. When the two-zone Gaussian model
was used, the mean of average MAD was about twice the value obtained with the
two-zone skew-normal-exponential model, and H 0 was rejected for more than
50% of zone 1 simulated samples (on average: 59.21%, for KS, and 81.63%, for
CvM) and more than 10% of zone 2 simulated samples (on average: 14.20%, for
KS, and 20.67%, for CvM).
Remark
The threshold dividing the two constant-SD zones was 75 mg/dL for OTU2 and
115 mg/dL for BCN. These results are, not surprisingly, coherent with the require-
ments (in terms of accuracy) imposed on SMBG devices by the standard ISO 15197.
Indeed, the 2003 standard [15] requires that 95% of the SMBG values should have
an absolute error lower than 15 mg/dL for glucose concentration lower than 75 mg/
dL and a relative error lower than 20% in the rest of the range, while the 2013 stan-
dard [16] requires that 95% of the SMBG values should have an absolute error lower
than 15 mg/dL for glucose concentration lower than 100 mg/dL and a relative error
lower than 15% in the rest of the range. In particular, the 75 mg/dL threshold we
found for OTU2, which was approved by FDA in 2006, reflects the same partition
defined by the standard ISO 15197:2003, while the 115 mg/dL threshold we found
for BCN, which was approved by FDA in 2012, is similar to the one defined by the
standard ISO 15197:2013.
Applications of the SMBG measurement error models
Models of SMBG measurement error can be used to generate synthetic SMBG data
in many interesting applications. For example, a reliable model of SMBG accuracy
can be used in in silico experiments for developing, testing, and optimizing insulin