
Page 102 - Glucose Monitoring Devices
P. 102
Derivation of a model of SMBG error distribution for two commercial devices 101
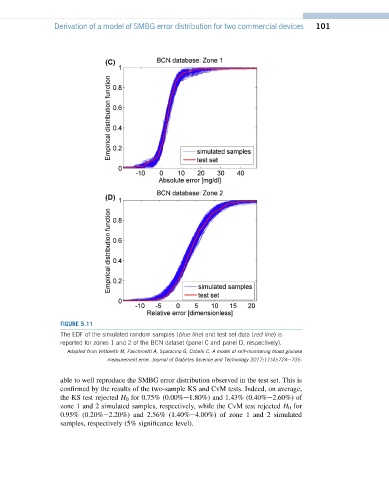
FIGURE 5.11
The EDF of the simulated random samples (blue line) and test set data (red line)is
reported for zones 1 and 2 of the BCN dataset (panel C and panel D, respectively).
Adapted from Vettoretti M, Facchinetti A, Sparacino G, Cobelli C. A model of self-monitoring blood glucose
measurement error. Journal of Diabetes Science and Technology 2017;11(4):724e735.
able to well reproduce the SMBG error distribution observed in the test set. This is
confirmed by the results of the two-sample KS and CvM tests. Indeed, on average,
the KS test rejected H 0 for 0.75% (0.00%e1.80%) and 1.43% (0.40%e2.60%) of
zone 1 and 2 simulated samples, respectively, while the CvM test rejected H 0 for
0.95% (0.20%e2.20%) and 2.56% (1.40%e4.00%) of zone 1 and 2 simulated
samples, respectively (5% significance level).