
Page 98 - Glucose Monitoring Devices
P. 98
Derivation of a model of SMBG error distribution for two commercial devices 97
After preprocessing the data, the SMBG samples selected for the analysis
resulted well distributed in the glycemic range with 123 samples below 50 mg/dL,
159 between 50 and 70 mg/dL, 463 between 70 and 180 mg/dL, 399 between 180
and 250 mg/dL, and 222 above 250 mg/dL.
Model development
The obtained SMBG-BG matched pairs (n tot ¼ 1366) were used to calculate SMBG
absolute and relative errors, which were divided into a training set (n training ¼ 2/
3n tot ) and a test set (n test ¼ 1/3n tot ). As for the OTU2 dataset, both absolute and
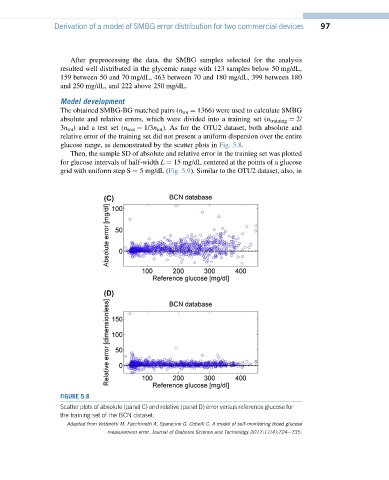
relative error of the training set did not present a uniform dispersion over the entire
glucose range, as demonstrated by the scatter plots in Fig. 5.8.
Then, the sample SD of absolute and relative error in the training set was plotted
for glucose intervals of half-width L ¼ 15 mg/dL centered at the points of a glucose
grid with uniform step S ¼ 5 mg/dL (Fig. 5.9). Similar to the OTU2 dataset, also, in
FIGURE 5.8
Scatter plots of absolute (panel C) and relative (panel D) error versus reference glucose for
the training set of the BCN dataset.
Adapted from Vettoretti M, Facchinetti A, Sparacino G, Cobelli C. A model of self-monitoring blood glucose
measurement error. Journal of Diabetes Science and Technology 2017;11(4):724e735.