
Page 93 - Glucose Monitoring Devices
P. 93
92 CHAPTER 5 Modeling the SMBG measurement error
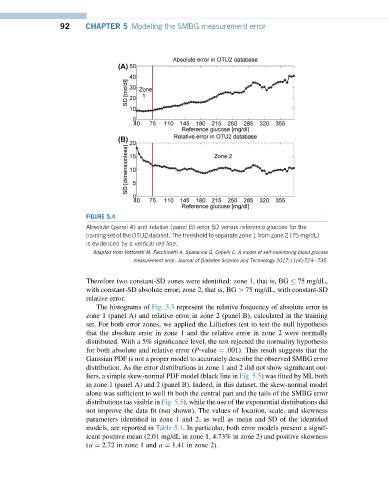
FIGURE 5.4
Absolute (panel A) and relative (panel B) error SD versus reference glucose for the
training set of the OTU2 dataset. The threshold to separate zone 1 from zone 2 (75 mg/dL)
is evidenced by a vertical red line.
Adapted from Vettoretti M, Facchinetti A, Sparacino G, Cobelli C. A model of self-monitoring blood glucose
measurement error. Journal of Diabetes Science and Technology 2017;11(4):724e735.
Therefore two constant-SD zones were identified: zone 1, that is, BG 75 mg/dL,
with constant-SD absolute error; zone 2, that is, BG > 75 mg/dL, with constant-SD
relative error.
The histograms of Fig. 5.5 represent the relative frequency of absolute error in
zone 1 (panel A) and relative error in zone 2 (panel B), calculated in the training
set. For both error zones, we applied the Lilliefors test to test the null hypothesis
that the absolute error in zone 1 and the relative error in zone 2 were normally
distributed. With a 5% significance level, the test rejected the normality hypothesis
for both absolute and relative error (P-value ¼ .001). This result suggests that the
Gaussian PDF is not a proper model to accurately describe the observed SMBG error
distribution. As the error distributions in zone 1 and 2 did not show significant out-
liers, a simple skew-normal PDF model (black line in Fig. 5.5) was fitted by ML both
in zone 1 (panel A) and 2 (panel B). Indeed, in this dataset, the skew-normal model
alone was sufficient to well fit both the central part and the tails of the SMBG error
distributions (as visible in Fig. 5.5), while the use of the exponential distributions did
not improve the data fit (not shown). The values of location, scale, and skewness
parameters identified in zone 1 and 2, as well as mean and SD of the identified
models, are reported in Table 5.1. In particular, both error models present a signif-
icant positive mean (2.01 mg/dL in zone 1, 4.73% in zone 2) and positive skewness
(a ¼ 2.72 in zone 1 and a ¼ 1.41 in zone 2).