
Page 94 - Glucose Monitoring Devices
P. 94
Derivation of a model of SMBG error distribution for two commercial devices 93
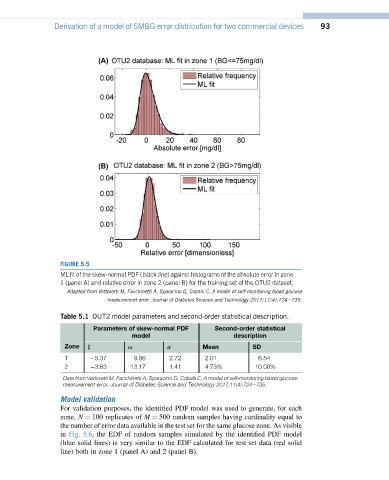
FIGURE 5.5
ML fit of the skew-normal PDF (black line) against histograms of the absolute error in zone
1 (panel A) and relative error in zone 2 (panel B) for the training set of the OTU2 dataset.
Adapted from Vettoretti M, Facchinetti A, Sparacino G, Cobelli C. A model of self-monitoring blood glucose
measurement error. Journal of Diabetes Science and Technology 2017;11(4):724e735.
Table 5.1 OUT2 model parameters and second-order statistical description.
Parameters of skew-normal PDF Second-order statistical
model description
Zone x u a Mean SD
1 5.37 9.86 2.72 2.01 6.54
2 3.83 13.17 1.41 4.73% 10.00%
Data from Vettoretti M, Facchinetti A, Sparacino G, Cobelli C. A model of self-monitoring blood glucose
measurement error. Journal of Diabetes Science and Technology 2017;11(4):724e735.
Model validation
For validation purposes, the identified PDF model was used to generate, for each
zone, N ¼ 100 replicates of M ¼ 500 random samples having cardinality equal to
the number of error data available in the test set for the same glucose zone. As visible
in Fig. 5.6, the EDF of random samples simulated by the identified PDF model
(blue solid lines) is very similar to the EDF calculated for test set data (red solid
line) both in zone 1 (panel A) and 2 (panel B).