
Page 96 - Glucose Monitoring Devices
P. 96
Derivation of a model of SMBG error distribution for two commercial devices 95
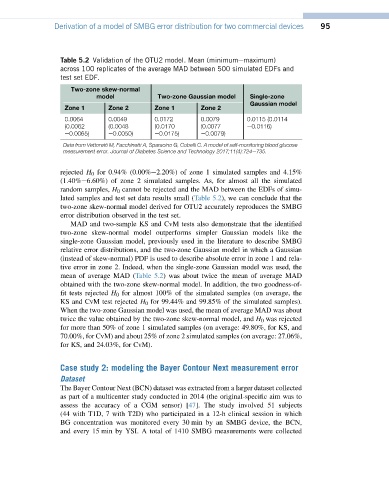
Table 5.2 Validation of the OTU2 model. Mean (minimumemaximum)
across 100 replicates of the average MAD between 500 simulated EDFs and
test set EDF.
Two-zone skew-normal
model Two-zone Gaussian model Single-zone
Gaussian model
Zone 1 Zone 2 Zone 1 Zone 2
0.0064 0.0049 0.0172 0.0079 0.0115 (0.0114
(0.0062 (0.0048 (0.0170 (0.0077 e0.0116)
e0.0065) e0.0050) e0.0175) e0.0079)
Data from Vettoretti M, Facchinetti A, Sparacino G, Cobelli C. A model of self-monitoring blood glucose
measurement error. Journal of Diabetes Science and Technology 2017;11(4):724e735.
rejected H 0 for 0.94% (0.00%e2.20%) of zone 1 simulated samples and 4.15%
(1.40%e6.60%) of zone 2 simulated samples. As, for almost all the simulated
random samples, H 0 cannot be rejected and the MAD between the EDFs of simu-
lated samples and test set data results small (Table 5.2), we can conclude that the
two-zone skew-normal model derived for OTU2 accurately reproduces the SMBG
error distribution observed in the test set.
MAD and two-sample KS and CvM tests also demonstrate that the identified
two-zone skew-normal model outperforms simpler Gaussian models like the
single-zone Gaussian model, previously used in the literature to describe SMBG
relative error distributions, and the two-zone Gaussian model in which a Gaussian
(instead of skew-normal) PDF is used to describe absolute error in zone 1 and rela-
tive error in zone 2. Indeed, when the single-zone Gaussian model was used, the
mean of average MAD (Table 5.2) was about twice the mean of average MAD
obtained with the two-zone skew-normal model. In addition, the two goodness-of-
fit tests rejected H 0 for almost 100% of the simulated samples (on average, the
KS and CvM test rejected H 0 for 99.44% and 99.85% of the simulated samples).
When the two-zone Gaussian model was used, the mean of average MAD was about
twice the value obtained by the two-zone skew-normal model, and H 0 was rejected
for more than 50% of zone 1 simulated samples (on average: 49.80%, for KS, and
70.00%, for CvM) and about 25% of zone 2 simulated samples (on average: 27.06%,
for KS, and 24.03%, for CvM).
Case study 2: modeling the Bayer Contour Next measurement error
Dataset
The Bayer Contour Next (BCN) dataset was extracted from a larger dataset collected
as part of a multicenter study conducted in 2014 (the original-specific aim was to
assess the accuracy of a CGM sensor) [47]. The study involved 51 subjects
(44 with T1D, 7 with T2D) who participated in a 12-h clinical session in which
BG concentration was monitored every 30 min by an SMBG device, the BCN,
and every 15 min by YSI. A total of 1410 SMBG measurements were collected