
Page 95 - Glucose Monitoring Devices
P. 95
94 CHAPTER 5 Modeling the SMBG measurement error
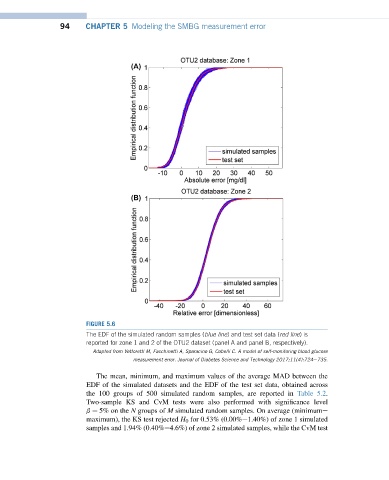
FIGURE 5.6
The EDF of the simulated random samples (blue line) and test set data (red line)is
reported for zone 1 and 2 of the OTU2 dataset (panel A and panel B, respectively).
Adapted from Vettoretti M, Facchinetti A, Sparacino G, Cobelli C. A model of self-monitoring blood glucose
measurement error. Journal of Diabetes Science and Technology 2017;11(4):724e735.
The mean, minimum, and maximum values of the average MAD between the
EDF of the simulated datasets and the EDF of the test set data, obtained across
the 100 groups of 500 simulated random samples, are reported in Table 5.2.
Two-sample KS and CvM tests were also performed with significance level
b ¼ 5% on the N groups of M simulated random samples. On average (minimume
maximum), the KS test rejected H 0 for 0.53% (0.00%e1.40%) of zone 1 simulated
samples and 1.94% (0.40%e4.6%) of zone 2 simulated samples, while the CvM test