
Page 90 - Glucose Monitoring Devices
P. 90
Derivation of a model of SMBG error distribution for two commercial devices 89
twice per hour for a 12-h period using the OTU2 meter. A total of 6906 SMBG sam-
ples were collected (on average 95 samples per subject). In parallel to SMBG, highly
accurate reference BG measurements were obtained every 15 min by YSI. During
the clinical sessions, carbohydrate and insulin administrations were managed to
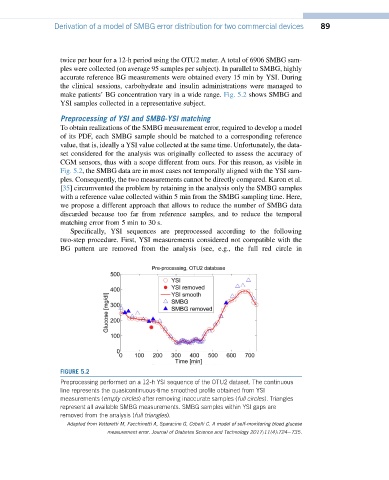
make patients’ BG concentration vary in a wide range. Fig. 5.2 shows SMBG and
YSI samples collected in a representative subject.
Preprocessing of YSI and SMBG-YSI matching
To obtain realizations of the SMBG measurement error, required to develop a model
of its PDF, each SMBG sample should be matched to a corresponding reference
value, that is, ideally a YSI value collected at the same time. Unfortunately, the data-
set considered for the analysis was originally collected to assess the accuracy of
CGM sensors, thus with a scope different from ours. For this reason, as visible in
Fig. 5.2, the SMBG data are in most cases not temporally aligned with the YSI sam-
ples. Consequently, the two measurements cannot be directly compared. Karon et al.
[35] circumvented the problem by retaining in the analysis only the SMBG samples
with a reference value collected within 5 min from the SMBG sampling time. Here,
we propose a different approach that allows to reduce the number of SMBG data
discarded because too far from reference samples, and to reduce the temporal
matching error from 5 min to 30 s.
Specifically, YSI sequences are preprocessed according to the following
two-step procedure. First, YSI measurements considered not compatible with the
BG pattern are removed from the analysis (see, e.g., the full red circle in
FIGURE 5.2
Preprocessing performed on a 12-h YSI sequence of the OTU2 dataset. The continuous
line represents the quasicontinuous-time smoothed profile obtained from YSI
measurements (empty circles) after removing inaccurate samples (full circles). Triangles
represent all available SMBG measurements. SMBG samples within YSI gaps are
removed from the analysis (full triangles).
Adapted from Vettoretti M, Facchinetti A, Sparacino G, Cobelli C. A model of self-monitoring blood glucose
measurement error. Journal of Diabetes Science and Technology 2017;11(4):724e735.