
Page 92 - Glucose Monitoring Devices
P. 92
Derivation of a model of SMBG error distribution for two commercial devices 91
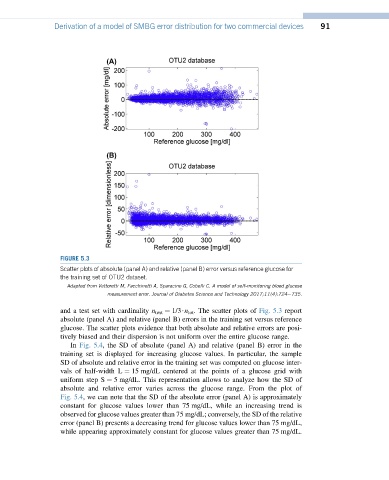
FIGURE 5.3
Scatter plots of absolute (panel A) and relative (panel B) error versus reference glucose for
the training set of OTU2 dataset.
Adapted from Vettoretti M, Facchinetti A, Sparacino G, Cobelli C. A model of self-monitoring blood glucose
measurement error. Journal of Diabetes Science and Technology 2017;11(4):724e735.
and a test set with cardinality n test ¼ 1/3$n tot . The scatter plots of Fig. 5.3 report
absolute (panel A) and relative (panel B) errors in the training set versus reference
glucose. The scatter plots evidence that both absolute and relative errors are posi-
tively biased and their dispersion is not uniform over the entire glucose range.
In Fig. 5.4, the SD of absolute (panel A) and relative (panel B) error in the
training set is displayed for increasing glucose values. In particular, the sample
SD of absolute and relative error in the training set was computed on glucose inter-
vals of half-width L ¼ 15 mg/dL centered at the points of a glucose grid with
uniform step S ¼ 5 mg/dL. This representation allows to analyze how the SD of
absolute and relative error varies across the glucose range. From the plot of
Fig. 5.4, we can note that the SD of the absolute error (panel A) is approximately
constant for glucose values lower than 75 mg/dL, while an increasing trend is
observed for glucose values greater than 75 mg/dL; conversely, the SD of the relative
error (panel B) presents a decreasing trend for glucose values lower than 75 mg/dL,
while appearing approximately constant for glucose values greater than 75 mg/dL.