
Page 97 - Glucose Monitoring Devices
P. 97
96 CHAPTER 5 Modeling the SMBG measurement error
(on average 27 per subject). Similarly, to the OTU2 dataset, diet, and insulin therapy
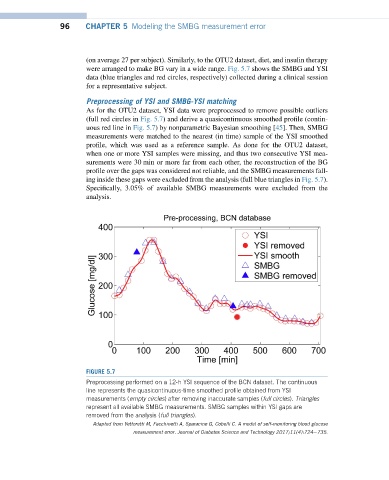
were arranged to make BG vary in a wide range. Fig. 5.7 shows the SMBG and YSI
data (blue triangles and red circles, respectively) collected during a clinical session
for a representative subject.
Preprocessing of YSI and SMBG-YSI matching
As for the OTU2 dataset, YSI data were preprocessed to remove possible outliers
(full red circles in Fig. 5.7) and derive a quasicontinuous smoothed profile (contin-
uous red line in Fig. 5.7) by nonparametric Bayesian smoothing [45]. Then, SMBG
measurements were matched to the nearest (in time) sample of the YSI smoothed
profile, which was used as a reference sample. As done for the OTU2 dataset,
when one or more YSI samples were missing, and thus two consecutive YSI mea-
surements were 30 min or more far from each other, the reconstruction of the BG
profile over the gaps was considered not reliable, and the SMBG measurements fall-
ing inside these gaps were excluded from the analysis (full blue triangles in Fig. 5.7).
Specifically, 3.05% of available SMBG measurements were excluded from the
analysis.
FIGURE 5.7
Preprocessing performed on a 12-h YSI sequence of the BCN dataset. The continuous
line represents the quasicontinuous-time smoothed profile obtained from YSI
measurements (empty circles) after removing inaccurate samples (full circles). Triangles
represent all available SMBG measurements. SMBG samples within YSI gaps are
removed from the analysis (full triangles).
Adapted from Vettoretti M, Facchinetti A, Sparacino G, Cobelli C. A model of self-monitoring blood glucose
measurement error. Journal of Diabetes Science and Technology 2017;11(4):724e735.