
Page 100 - Glucose Monitoring Devices
P. 100
Derivation of a model of SMBG error distribution for two commercial devices 99
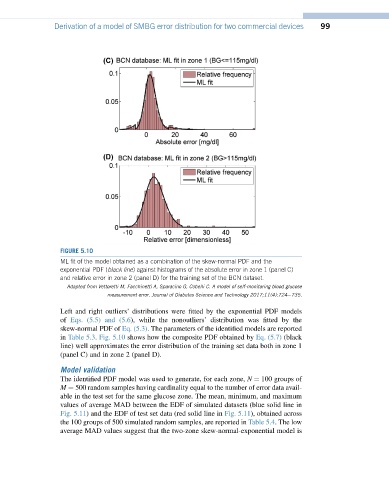
FIGURE 5.10
ML fit of the model obtained as a combination of the skew-normal PDF and the
exponential PDF (black line) against histograms of the absolute error in zone 1 (panel C)
and relative error in zone 2 (panel D) for the training set of the BCN dataset.
Adapted from Vettoretti M, Facchinetti A, Sparacino G, Cobelli C. A model of self-monitoring blood glucose
measurement error. Journal of Diabetes Science and Technology 2017;11(4):724e735.
Left and right outliers’ distributions were fitted by the exponential PDF models
of Eqs. (5.5) and (5.6), while the nonoutliers’ distribution was fitted by the
skew-normal PDF of Eq. (5.3). The parameters of the identified models are reported
in Table 5.3. Fig. 5.10 shows how the composite PDF obtained by Eq. (5.7) (black
line) well approximates the error distribution of the training set data both in zone 1
(panel C) and in zone 2 (panel D).
Model validation
The identified PDF model was used to generate, for each zone, N ¼ 100 groups of
M ¼ 500 random samples having cardinality equal to the number of error data avail-
able in the test set for the same glucose zone. The mean, minimum, and maximum
values of average MAD between the EDF of simulated datasets (blue solid line in
Fig. 5.11) and the EDF of test set data (red solid line in Fig. 5.11), obtained across
the 100 groups of 500 simulated random samples, are reported in Table 5.4. The low
average MAD values suggest that the two-zone skew-normal-exponential model is