
Page 99 - Glucose Monitoring Devices
P. 99
98 CHAPTER 5 Modeling the SMBG measurement error
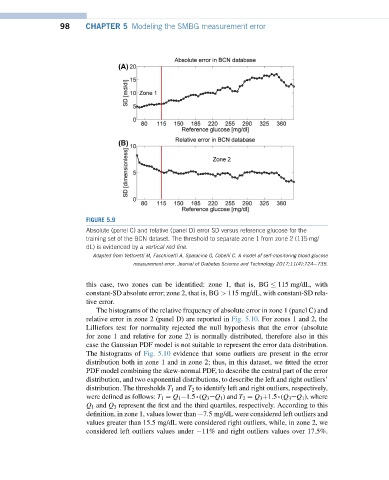
FIGURE 5.9
Absolute (panel C) and relative (panel D) error SD versus reference glucose for the
training set of the BCN dataset. The threshold to separate zone 1 from zone 2 (115 mg/
dL) is evidenced by a vertical red line.
Adapted from Vettoretti M, Facchinetti A, Sparacino G, Cobelli C. A model of self-monitoring blood glucose
measurement error. Journal of Diabetes Science and Technology 2017;11(4):724e735.
this case, two zones can be identified: zone 1, that is, BG 115 mg/dL, with
constant-SD absolute error; zone 2, that is, BG > 115 mg/dL, with constant-SD rela-
tive error.
The histograms of the relative frequency of absolute error in zone 1 (panel C) and
relative error in zone 2 (panel D) are reported in Fig. 5.10. For zones 1 and 2, the
Lilliefors test for normality rejected the null hypothesis that the error (absolute
for zone 1 and relative for zone 2) is normally distributed, therefore also in this
case the Gaussian PDF model is not suitable to represent the error data distribution.
The histograms of Fig. 5.10 evidence that some outliers are present in the error
distribution both in zone 1 and in zone 2; thus, in this dataset, we fitted the error
PDF model combining the skew-normal PDF, to describe the central part of the error
distribution, and two exponential distributions, to describe the left and right outliers’
distribution. The thresholds T 1 and T 2 to identify left and right outliers, respectively,
were defined as follows: T 1 ¼ Q 1 1.5∙(Q 3 eQ 1 ) and T 2 ¼ Q 3 þ1.5∙(Q 3 eQ 1 ), where
Q 1 and Q 3 represent the first and the third quartiles, respectively. According to this
definition, in zone 1, values lower than 7.5 mg/dL were considered left outliers and
values greater than 15.5 mg/dL were considered right outliers, while, in zone 2, we
considered left outliers values under 11% and right outliers values over 17.5%.