
Page 160 - Glucose Monitoring Devices
P. 160
Clinical accuracy 161
400
300
CGM BG (mg/dl) 200
100
0
0 100 200 300 400
Reference BG (mg/dl)
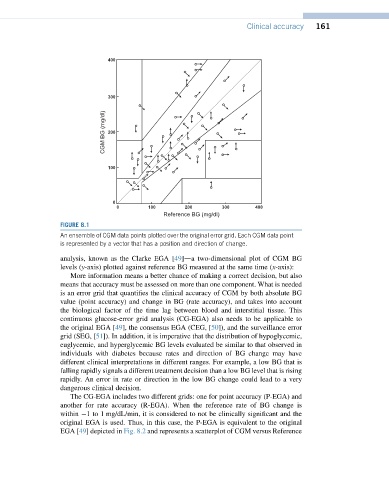
FIGURE 8.1
An ensemble of CGM data points plotted over the original error grid. Each CGM data point
is represented by a vector that has a position and direction of change.
analysis, known as the Clarke EGA [49]da two-dimensional plot of CGM BG
levels (y-axis) plotted against reference BG measured at the same time (x-axis):
More information means a better chance of making a correct decision, but also
means that accuracy must be assessed on more than one component. What is needed
is an error grid that quantifies the clinical accuracy of CGM by both absolute BG
value (point accuracy) and change in BG (rate accuracy), and takes into account
the biological factor of the time lag between blood and interstitial tissue. This
continuous glucose-error grid analysis (CG-EGA) also needs to be applicable to
the original EGA [49], the consensus EGA (CEG, [50]), and the surveillance error
grid (SEG, [51]). In addition, it is imperative that the distribution of hypoglycemic,
euglycemic, and hyperglycemic BG levels evaluated be similar to that observed in
individuals with diabetes because rates and direction of BG change may have
different clinical interpretations in different ranges. For example, a low BG that is
falling rapidly signals a different treatment decision than a low BG level that is rising
rapidly. An error in rate or direction in the low BG change could lead to a very
dangerous clinical decision.
The CG-EGA includes two different grids: one for point accuracy (P-EGA) and
another for rate accuracy (R-EGA). When the reference rate of BG change is
within 1 to 1 mg/dL/min, it is considered to not be clinically significant and the
original EGA is used. Thus, in this case, the P-EGA is equivalent to the original
EGA [49] depicted in Fig. 8.2 and represents a scatterplot of CGM versus Reference