
Page 163 - Glucose Monitoring Devices
P. 163
164 CHAPTER 8 Accuracy of CGM systems
4
3 uCR
uER
2
CGM Rate (mg/dl/min) 1 0 uDR uBR lDR
-1
lBR
-2
lER
AR Zone
-3 lCR
-4
-4 -3 -2 -1 0 1 2 3 4
Reference Rate (mg/dl/min)
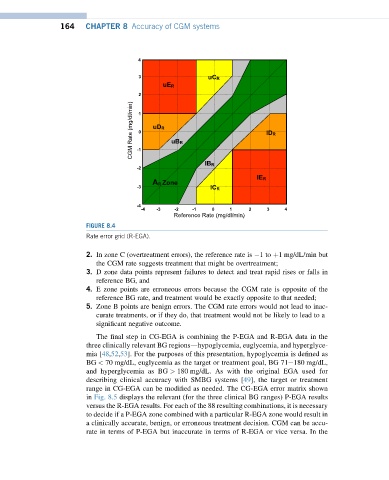
FIGURE 8.4
Rate error grid (R-EGA).
2. In zone C (overtreatment errors), the reference rate is 1to þ1 mg/dL/min but
the CGM rate suggests treatment that might be overtreatment;
3. D zone data points represent failures to detect and treat rapid rises or falls in
reference BG, and
4. E zone points are erroneous errors because the CGM rate is opposite of the
reference BG rate, and treatment would be exactly opposite to that needed;
5. Zone B points are benign errors. The CGM rate errors would not lead to inac-
curate treatments, or if they do, that treatment would not be likely to lead to a
significant negative outcome.
The final step in CG-EGA is combining the P-EGA and R-EGA data in the
three clinically relevant BG regionsdhypoglycemia, euglycemia, and hyperglyce-
mia [48,52,53]. For the purposes of this presentation, hypoglycemia is defined as
BG < 70 mg/dL, euglycemia as the target or treatment goal, BG 71e180 mg/dL,
and hyperglycemia as BG > 180 mg/dL. As with the original EGA used for
describing clinical accuracy with SMBG systems [49], the target or treatment
range in CG-EGA can be modified as needed. The CG-EGA error matrix shown
in Fig. 8.5 displays the relevant (for the three clinical BG ranges) P-EGA results
versus the R-EGA results. For each of the 88 resulting combinations, it is necessary
to decide if a P-EGA zone combined with a particular R-EGA zone would result in
a clinically accurate, benign, or erroneous treatment decision. CGM can be accu-
rate in terms of P-EGA but inaccurate interms of R-EGAorvice versa.Inthe