
Page 165 - Glucose Monitoring Devices
P. 165
166 CHAPTER 8 Accuracy of CGM systems
criteria for good technical point accuracy performance of continuous glucose mon-
itors.” The point accuracy criteria for CGM presented by POCT05-A do not
include the ISO recommendations for SMBG systems that currently require 95%
of SMBG values to be within 15% of reference values over 100 mg/dL and within
15 mg/dL of reference BG values under 100 mg/dL [55]. Current FDA standards
for SMBG systems also require 95% of all SMBG values to be within 15% of
all reference values and 99% to be within 20% of all reference values [56]. How-
ever, no compensation or corrections for the time lag between blood and interstitial
tissue are routinely included when the numerical accuracy of CGM is considered.
To account for the numerical accuracy of CGM rate of change, POCT05-A
included a suggestion for evaluation of the numerical agreement between the mea-
surement of CGM and the true rate of change of blood glucose fluctuations and
proposed a metric of the rate of change (or trend) accuracy, R-deviation (RD)
[54]. The CLSI guidelines recommend the inclusion of trend analysis using RD
as part of the data submitted for approval of new CGM, as well as the absolute
R-deviation (ARD) that can be used to assess the proximity between the underlying
rate of blood glucose fluctuations and the rate displayed by CGM. RD and ARD are
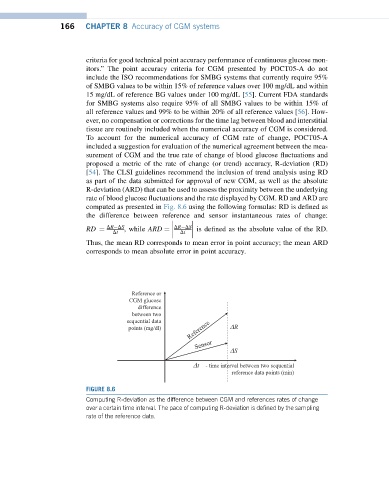
computed as presented in Fig. 8.6 using the following formulas: RD is defined as
the difference between reference and sensor instantaneous rates of change:
DR DS
RD ¼ , while ARD ¼ DR DS is defined as the absolute value of the RD.
Dt Dt
Thus, the mean RD corresponds to mean error in point accuracy; the mean ARD
corresponds to mean absolute error in point accuracy.
Reference or
CGM glucose
difference
between two
sequential data
points (mg/dl) R
S
t - time interval between two sequential
reference data points (min)
FIGURE 8.6
Computing R-deviation as the difference between CGM and references rates of change
over a certain time interval. The pace of computing R-deviation is defined by the sampling
rate of the reference data.