
Page 161 - Glucose Monitoring Devices
P. 161
162 CHAPTER 8 Accuracy of CGM systems
400
uCP
300 uEP AP Zone
CGM BG (mg/dl) 200 uBP
uDP lDP
100
lBP
lEP
lCP
0
0 100 200 300 400
Reference BG (mg/dl)
FIGURE 8.2
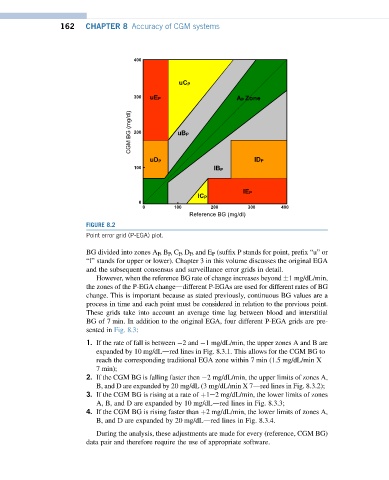
Point error grid (P-EGA) plot.
BG divided into zones A P ,B P ,C P ,D P , and E P (suffix P stands for point, prefix “u” or
“l” stands for upper or lower). Chapter 3 in this volume discusses the original EGA
and the subsequent consensus and surveillance error grids in detail.
However, when the reference BG rate of change increases beyond 1mg/dL/min,
the zones of the P-EGA changeddifferent P-EGAs are used for different rates of BG
change. This is important because as stated previously, continuous BG values are a
process in time and each point must be considered in relation to the previous point.
These grids take into account an average time lag between blood and interstitial
BG of 7 min. In addition to the original EGA, four different P-EGA grids are pre-
sented in Fig. 8.3:
1. If the rate of fall is between 2and 1 mg/dL/min, the upper zones A and B are
expanded by 10 mg/dLdred lines in Fig. 8.3.1. This allows for the CGM BG to
reach the corresponding traditional EGA zone within 7 min (1.5 mg/dL/min X
7min);
2. If the CGM BG is falling faster then 2 mg/dL/min, the upper limits of zones A,
B, and D are expanded by 20 mg/dL (3 mg/dL/min X 7dred lines in Fig. 8.3.2);
3. If the CGM BG is rising at a rate of þ1e2 mg/dL/min, the lower limits of zones
A, B, and D are expanded by 10 mg/dLdred lines in Fig. 8.3.3;
4. If the CGM BG is rising faster than þ2 mg/dL/min, the lower limits of zones A,
B, and D are expanded by 20 mg/dLdred lines in Fig. 8.3.4.
During the analysis, these adjustments are made for every (reference, CGM BG)
data pair and therefore require the use of appropriate software.