
Page 162 - Glucose Monitoring Devices
P. 162
Clinical accuracy 163
1: Reference Rate of [-2,-1) mg/dl/min: 3. Reference Rate of (1,2] mg/dl/min:
400 400
uCp 300 uEp uCp
Moderate BG Fluctuation Estimated BG (mg/dl) 200 uDp uBp lBp Ap Estimated BG (mg/dl) 200 uDp uBp lBp Ap
300
uEp
100
lEp lDp 100 lEp lDp
0 lCp 0 lC
0 100 200 300 400 0 100 200 300 400
Reference BG (mg/dl) Reference BG (mg/dl)
2. BG falls faster than –2 mg/dl/min: 4. BG rises faster than 2 mg/dl/min:
400 400
uCp 300 uEp uCp
300
Rapid BG Fluctuation Estimated BG (mg/dl) 200 uDp uBp lBp Ap Estimated BG (mg/dl) 200 uDp uBp Ap
uEp
100
lEp lDp 100 lBp lEp lDp
0 lCp 0 lC
0 100 200 300 400 0 100 200 300 400
Reference BG (mg/dl) Reference BG (mg/dl)
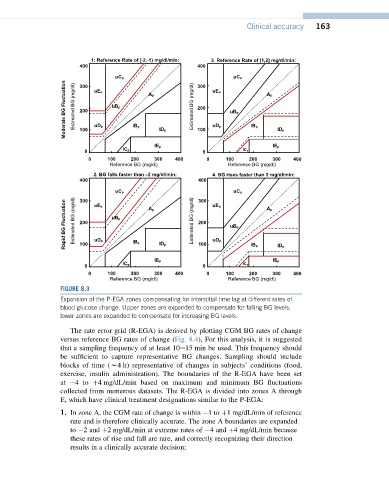
FIGURE 8.3
Expansion of the P-EGA zones compensating for interstitial time lag at different rates of
blood glucose change. Upper zones are expanded to compensate for falling BG levels;
lower zones are expanded to compensate for increasing BG levels.
The rate error grid (R-EGA) is derived by plotting CGM BG rates of change
versus reference BG rates of change (Fig. 8.4), For this analysis, it is suggested
that a sampling frequency of at least 10e15 min be used. This frequency should
be sufficient to capture representative BG changes. Sampling should include
blocks of time (w4 h) representative of changes in subjects’ conditions (food,
exercise, insulin administration). The boundaries of the R-EGA have been set
at 4to þ4 mg/dL/min based on maximum and minimum BG fluctuations
collected from numerous datasets. The R-EGA is divided into zones A through
E, which have clinical treatment designations similar to the P-EGA:
1. In zone A, the CGM rate of change is within 1to þ1 mg/dL/min of reference
rate and is therefore clinically accurate. The zone A boundaries are expanded
to 2 and þ2 mg/dL/min at extreme rates of 4 and þ4 mg/dL/min because
these rates of rise and fall are rare, and correctly recognizing their direction
results in a clinically accurate decision;