
Page 172 - Glucose Monitoring Devices
P. 172
174 CHAPTER 9 Calibration of CGM systems
Calibration of minimally invasive CGM sensors
Problem statement
The calibration process consists in the estimation of a mathematical model that con-
verts the electrical current signal measured by the sensor (in fractions of ampere)
into glucose concentration values (in mg/dL).
Letting uðtÞ be the glucose concentration profile, yðtÞ the electrical current
signal, and fð $Þ the function of parameters P ¼½p 1 ; p 2 ; .; p n that relates uðtÞ
and yðtÞ, the calibration process can be schematized in two steps (illustrated in
panels (A) and (B) of Fig. 9.1). The first step consists in the identification of the
calibration model parameters P. In formal terms, the current signal yðtÞ collected
by the sensor and corrupted by measurement error wðtÞ, and the blood glucose
(BG) measurements (samples of uðtÞ) acquired by the patient at correspondent
time instants, are described by the model (see Fig. 9.1, panel (A)):
yðtÞ¼ fðP; uðtÞÞ þ wðtÞ (9.1)
from which a numerical value P of the calibration parameter vector can be provided
b
using, for instance, parametric estimation techniques. This step can be repeated each
time a new BG reference is available, with consequent updates of the calibration
parameters P (e.g., every 12e24 h by acquiring SMBG samples). The second step
b
leads to the estimation of the glucose concentration profile (see Fig. 9.1, panel
(B)). Formally, from the vector of estimated parameters P and the measured current
b
profile yðtÞ, the calibrated glycemic profile b uðtÞ is obtained in real time by inverting
the calibration function fð $Þ:
b uðtÞ¼ f 1 b (9.2)
P; yðtÞ
(A)
(B)
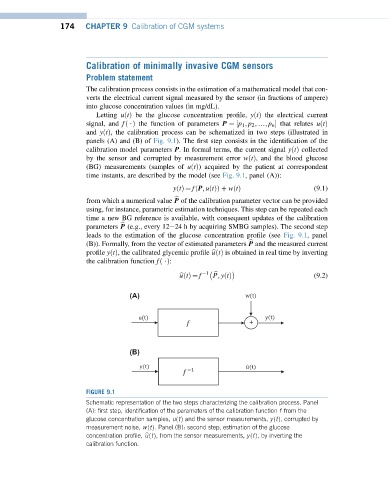
FIGURE 9.1
Schematic representation of the two steps characterizing the calibration process. Panel
(A): first step, identification of the parameters of the calibration function f from the
glucose concentration samples, uðtÞ and the sensor measurements, yðtÞ, corrupted by
measurement noise, wðtÞ. Panel (B): second step, estimation of the glucose
concentration profile, b uðtÞ, from the sensor measurements, yðtÞ, by inverting the
calibration function.