
Page 174 - Glucose Monitoring Devices
P. 174
176 CHAPTER 9 Calibration of CGM systems
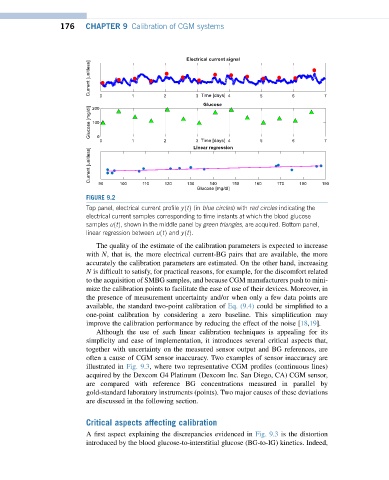
FIGURE 9.2
Top panel, electrical current profile yðtÞ (in blue circles) with red circles indicating the
electrical current samples corresponding to time instants at which the blood glucose
samples uðtÞ, shown in the middle panel by green triangles, are acquired. Bottom panel,
linear regression between uðtÞ and yðtÞ.
The quality of the estimate of the calibration parameters is expected to increase
with N, that is, the more electrical current-BG pairs that are available, the more
accurately the calibration parameters are estimated. On the other hand, increasing
N is difficult to satisfy, for practical reasons, for example, for the discomfort related
to the acquisition of SMBG samples, and because CGM manufacturers push to mini-
mize the calibration points to facilitate the ease of use of their devices. Moreover, in
the presence of measurement uncertainty and/or when only a few data points are
available, the standard two-point calibration of Eq. (9.4) could be simplified to a
one-point calibration by considering a zero baseline. This simplification may
improve the calibration performance by reducing the effect of the noise [18,19].
Although the use of such linear calibration techniques is appealing for its
simplicity and ease of implementation, it introduces several critical aspects that,
together with uncertainty on the measured sensor output and BG references, are
often a cause of CGM sensor inaccuracy. Two examples of sensor inaccuracy are
illustrated in Fig. 9.3, where two representative CGM profiles (continuous lines)
acquired by the Dexcom G4 Platinum (Dexcom Inc. San Diego, CA) CGM sensor,
are compared with reference BG concentrations measured in parallel by
gold-standard laboratory instruments (points). Two major causes of these deviations
are discussed in the following section.
Critical aspects affecting calibration
A first aspect explaining the discrepancies evidenced in Fig. 9.3 is the distortion
introduced by the blood glucose-to-interstitial glucose (BG-to-IG) kinetics. Indeed,