
Page 177 - Glucose Monitoring Devices
P. 177
Calibration of minimally invasive CGM sensors 179
panel (B), where the IG profile (obtained by convolving a given, simulated, BG
profile with a single exponential with s ¼ 11 min) shows both amplitude attenuation
and phase delay compared to the BG profile. Notably, s shows inter- and intrasubject
variability and its numerical identification requires a suitable collection of both BG
and IG samples. Published values of the time constant s range from 6 to 15 min [21].
In practice, the BG-to-IG time constant s is treated as a user parameter, but its role in
the calibration process needs to be carefully considered [23,24].
A second critical aspect behind the differences pointed out in Fig. 9.3 is related to
the time variability of sensor sensitivity. The raw electrical current signals acquired
by CGM sensors often exhibit a nonphysiological drift, especially on the first day
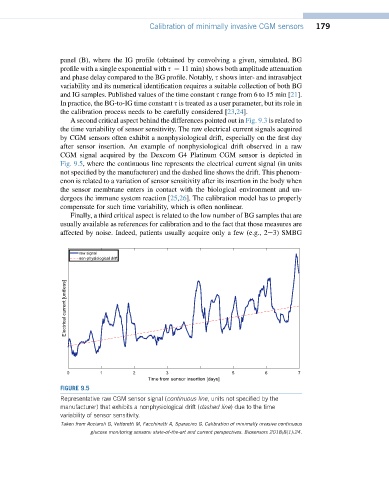
after sensor insertion. An example of nonphysiological drift observed in a raw
CGM signal acquired by the Dexcom G4 Platinum CGM sensor is depicted in
Fig. 9.5, where the continuous line represents the electrical current signal (in units
not specified by the manufacturer) and the dashed line shows the drift. This phenom-
enon is related to a variation of sensor sensitivity after its insertion in the body when
the sensor membrane enters in contact with the biological environment and un-
dergoes the immune system reaction [25,26]. The calibration model has to properly
compensate for such time variability, which is often nonlinear.
Finally, a third critical aspect is related to the low number of BG samples that are
usually available as references for calibration and to the fact that those measures are
affected by noise. Indeed, patients usually acquire only a few (e.g., 2e3) SMBG
FIGURE 9.5
Representative raw CGM sensor signal (continuous line, units not specified by the
manufacturer) that exhibits a nonphysiological drift (dashed line) due to the time
variability of sensor sensitivity.
Taken from Acciaroli G, Vettoretti M, Facchinetti A, Sparacino G. Calibration of minimally invasive continuous
glucose monitoring sensors: state-of-the-art and current perspectives. Biosensors 2018;8(1):24.