Page 273 - Glucose Monitoring Devices
P. 273

280    CHAPTER 14 Predictive low glucose suspend systems


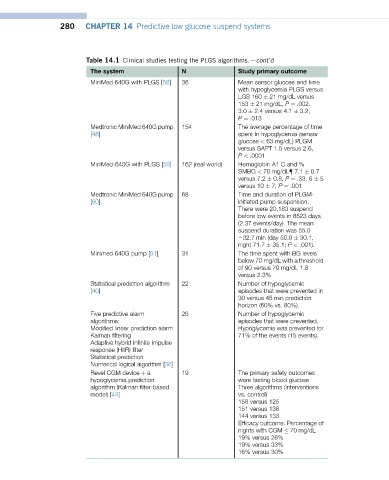
                         Table 14.1 Clinical studies testing the PLGS algorithms.dcont’d
                          The system               N               Study primary outcome
                          MiniMed 640G with PLGS [58]  36          Mean sensor glucose and time
                                                                   with hypoglycemia PLGS versus
                                                                   LGS 160   21 mg/dL versus
                                                                   153   21 mg/dL, P ¼ .002.
                                                                   3.0   2.4 versus 4.1   3.2,
                                                                   P ¼ .013
                          Medtronic MiniMed 640G pump  154         The average percentage of time
                          [48]                                     spent in hypoglycemia (sensor
                                                                   glucose < 63 mg/dL) PLGM
                                                                   versus SAPT 1.5 versus 2.6,
                                                                   P < .0001
                          MiniMed-640G with PLGS [59]  162 (real world)  Hemoglobin A1 C and %
                                                                   SMBG < 70 mg/dL{ 7.1   0.7
                                                                   versus 7.2   0.8, P ¼ .33. 6   5
                                                                   versus 10   7, P ¼ .001
                          Medtronic MiniMed 640G pump  68          Time and duration of PLGM-
                          [60]                                     initiated pump suspension.
                                                                   There were 20,183 suspend
                                                                   before low events in 8523 days
                                                                   (2.37 events/day). The mean
                                                                   suspend duration was 55.0
                                                                   e32.7 min (day 50.0   30.1,
                                                                   night 71.7   35.1; P < .001).
                          Minimed 640G pump [61]   31              The time spent with BG levels
                                                                   below 70 mg/dL with a threshold
                                                                   of 90 versus 70 mg/dL 1.8
                                                                   versus 2.3%
                          Statistical prediction algorithm  22     Number of hypoglycemic
                          [40]                                     episodes that were prevented in
                                                                   30 versus 45 min prediction
                                                                   horizon (60% vs. 80%).
                          Five predictive alarm    26              Number of hypoglycemic
                          algorithms:                              episodes that were prevented.
                          Modified linear prediction alarm          Hypoglycemia was prevented for
                          Kalman filtering                          71% of the events (15 events).
                          Adaptive hybrid infinite impulse
                          response (HIIR) filter
                          Statistical prediction
                          Numerical logical algorithm [36]
                          Revel CGM device þ a     19              The primary safety outcomes
                          hypoglycemia prediction                  were fasting blood glucose
                          algorithm (Kalman filter-based            Three algorithms (interventions
                          model) [43]                              vs. control)
                                                                   158 versus 125
                                                                   151 versus 138
                                                                   144 versus 133
                                                                   Efficacy outcome: Percentage of
                                                                   nights with CGM   70 mg/dL
                                                                   19% versus 26%
                                                                   19% versus 33%
                                                                   16% versus 30%
   268   269   270   271   272   273   274   275   276   277   278