
Page 314 - Glucose Monitoring Devices
P. 314
Conclusions 321
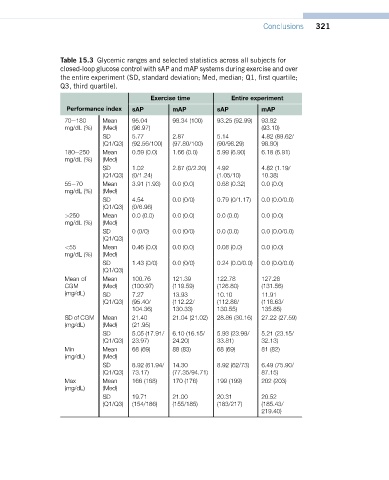
Table 15.3 Glycemic ranges and selected statistics across all subjects for
closed-loop glucose control with sAP and mAP systems during exercise and over
the entire experiment (SD, standard deviation; Med, median; Q1, first quartile;
Q3, third quartile).
Exercise time Entire experiment
Performance index sAP mAP sAP mAP
70e180 Mean 95.04 98.34 (100) 93.25 (92.99) 93.82
mg/dL (%) (Med) (96.97) (93.10)
SD 5.77 2.87 5.14 4.82 (89.62/
(Q1/Q3) (92.56/100) (97.80/100) (90/98.29) 98.80)
180e250 Mean 0.59 (0.0) 1.66 (0.0) 5.99 (6.90) 6.18 (6.91)
mg/dL (%) (Med)
SD 1.02 2.87 (0/2.20) 4.92 4.82 (1.19/
(Q1/Q3) (0/1.24) (1.05/10) 10.38)
55e70 Mean 3.91 (1.93) 0.0 (0.0) 0.68 (0.32) 0.0 (0.0)
mg/dL (%) (Med)
SD 4.54 0.0 (0/0) 0.79 (0/1.17) 0.0 (0.0/0.0)
(Q1/Q3) (0/6.96)
>250 Mean 0.0 (0.0) 0.0 (0.0) 0.0 (0.0) 0.0 (0.0)
mg/dL (%) (Med)
SD 0 (0/0) 0.0 (0/0) 0.0 (0.0) 0.0 (0.0/0.0)
(Q1/Q3)
<55 Mean 0.46 (0.0) 0.0 (0.0) 0.08 (0.0) 0.0 (0.0)
mg/dL (%) (Med)
SD 1.43 (0/0) 0.0 (0/0) 0.24 (0.0/0.0) 0.0 (0.0/0.0)
(Q1/Q3)
Mean of Mean 100.76 121.39 122.78 127.28
CGM (Med) (100.97) (119.59) (126.80) (131.56)
(mg/dL) SD 7.27 13.93 10.10 11.91
(Q1/Q3) (95.40/ (112.22/ (112.86/ (116.63/
104.36) 130.33) 130.55) 135.85)
SD of CGM Mean 21.40 21.04 (21.02) 28.86 (30.16) 27.22 (27.59)
(mg/dL) (Med) (21.95)
SD 5.05 (17.91/ 6.10 (16.15/ 5.93 (23.99/ 5.21 (23.15/
(Q1/Q3) 23.97) 24.20) 33.81) 32.13)
Min Mean 68 (69) 88 (83) 68 (69) 81 (82)
(mg/dL) (Med)
SD 8.92 (61.94/ 14.30 8.92 (62/73) 6.49 (75.90/
(Q1/Q3) 73.17) (77.35/94.71) 87.15)
Max Mean 166 (168) 170 (176) 199 (199) 202 (203)
(mg/dL) (Med)
SD 19.71 21.00 20.31 20.52
(Q1/Q3) (154/186) (155/185) (183/217) (185.43/
219.40)