
Page 66 - Glucose Monitoring Devices
P. 66
64 CHAPTER 4 Consequences of SMBG systems inaccuracy
The in silico study
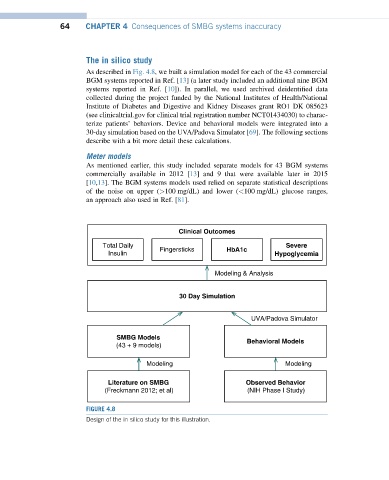
As described in Fig. 4.8, we built a simulation model for each of the 43 commercial
BGM systems reported in Ref. [13] (a later study included an additional nine BGM
systems reported in Ref. [10]). In parallel, we used archived deidentified data
collected during the project funded by the National Institutes of Health/National
Institute of Diabetes and Digestive and Kidney Diseases grant RO1 DK 085623
(see clinicaltrial.gov for clinical trial registration number NCT01434030) to charac-
terize patients’ behaviors. Device and behavioral models were integrated into a
30-day simulation based on the UVA/Padova Simulator [69]. The following sections
describe with a bit more detail these calculations.
Meter models
As mentioned earlier, this study included separate models for 43 BGM systems
commercially available in 2012 [13] and 9 that were available later in 2015
[10,13]. The BGM systems models used relied on separate statistical descriptions
of the noise on upper (>100 mg/dL) and lower (<100 mg/dL) glucose ranges,
an approach also used in Ref. [81].
Clinical Outcomes
Total Daily Fingersticks Severe
Insulin HbA1c Hypoglycemia
Modeling & Analysis
30 Day Simulation
UVA/Padova Simulator
SMBG Models
Behavioral Models
(43 + 9 models)
Modeling Modeling
Literature on SMBG Observed Behavior
(Freckmann 2012; et al) (NIH Phase I Study)
FIGURE 4.8
Design of the in silico study for this illustration.