
Page 69 - Glucose Monitoring Devices
P. 69
An extended illustration 67
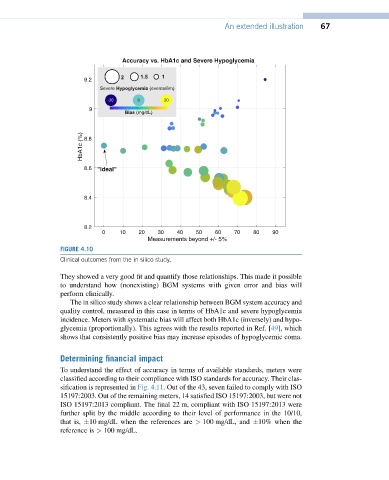
Accuracy vs. HbA1c and Severe Hypoglycemia
9.2 2 1.5 1
Severe Hypoglycemia (events/6m)
-20 0 20
9
Bias (mg/dL)
HbA1c (%) 8.8
8.6 "Ideal"
8.4
8.2
0 10 20 30 40 50 60 70 80 90
Measurements beyond +/- 5%
FIGURE 4.10
Clinical outcomes from the in silico study.
They showed a very good fit and quantify those relationships. This made it possible
to understand how (nonexisting) BGM systems with given error and bias will
perform clinically.
The in silico study shows a clear relationship between BGM system accuracy and
quality control, measured in this case in terms of HbA1c and severe hypoglycemia
incidence. Meters with systematic bias will affect both HbA1c (inversely) and hypo-
glycemia (proportionally). This agrees with the results reported in Ref. [49], which
shows that consistently positive bias may increase episodes of hypoglycemic coma.
Determining financial impact
To understand the effect of accuracy in terms of available standards, meters were
classified according to their compliance with ISO standards for accuracy. Their clas-
sification is represented in Fig. 4.11. Out of the 43, seven failed to comply with ISO
15197:2003. Out of the remaining meters, 14 satisfied ISO 15197:2003, but were not
ISO 15197:2013 compliant. The final 22 m, compliant with ISO 15197:2013 were
further split by the middle according to their level of performance in the 10/10,
that is, 10 mg/dL when the references are > 100 mg/dL, and 10% when the
reference is > 100 mg/dL.